TradaZen

In 20 seconds
- Definition
- The account's decline from its peak, as a percentage of that peak.
- Maximum drawdown
- The worst of these declines over a period: from the peak to the low that follows it.
- Recovery
- A 20% decline needs a 25% rise to recover; a 50% decline, a 100% rise.
- Bitcoin, 2021-2025
- A 77% decline between November 2021 and November 2022, only erased in March 2024.
- Size
- Ten losses in a row mean a 9.6% drawdown at 1% risk per trade, 40.1% at 5%.
Drawdown measures what your account has lost since its best level. You saw it climb to €10,000, and now it sits at €8,500: your drawdown is 15%. Maximum drawdown is the worst of these dips over a period. That number tells you whether you would have held on, far more than the final result does.
This guide describes a training method, not investment advice. Trading carries a high risk of capital loss.
Reading it on a curve
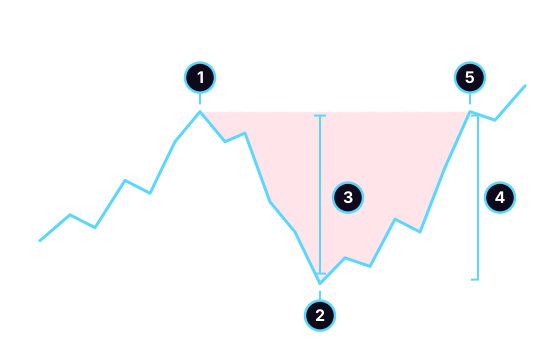
- The peak: the highest level the account has reached.
- The trough: the lowest point that follows, before any new peak.
- The drawdown: from peak to trough, here half the account.
- The recovery: the same distance, which this time is a 100% rise, because it is measured from the trough.
- The return to the peak, which ends the drawdown. The red zone shows the time spent below the old high.
The formula fits on one line:
drawdown = (peak − current value) ÷ peak
Example: peak at €10,000, account at €8,500. (10,000 − 8,500) ÷ 10,000 = 15%. Drawdown is always measured from the peak, not from your initial deposit. An account that went from €10,000 to €14,000, then fell back to €11,000, is still above the deposit, but in a 21.4% drawdown.
The math of recovery
The decline is measured from the peak, and the rise that erases it from the trough, which is lower. So you always need a bigger rise than the decline:
| Drawdown | Rise needed to recover |
|---|---|
| 10% | 11.1% |
| 20% | 25% |
| 30% | 42.9% |
| 50% | 100% |
| 75% | 300% |
The formula: rise needed = 1 ÷ (1 − drawdown) − 1. Up to 10%, the gap is small. Beyond 30%, it runs away.
Bitcoin's largest drawdowns, 2021-2025
Bitcoin's five largest declines from a peak:
| From the peak | To the trough | Decline | Back to the peak |
|---|---|---|---|
| Nov 9, 2021 | Nov 21, 2022 | 77% | Mar 8, 2024 |
| Apr 14, 2021 | Jul 20, 2021 | 54.1% | Oct 20, 2021 |
| Oct 6, 2025 | Nov 21, 2025 | 34.4% | not by Dec 31, 2025 |
| Jan 20, 2025 | Apr 9, 2025 | 30.6% | May 21, 2025 |
| Mar 13, 2024 | Aug 5, 2024 | 30% | Nov 6, 2024 |
Method: BTC/USDT, 4-hour candle closes, public Binance data, from January 1, 2021 to December 31, 2025, or 10,956 candles. An episode runs from a closing high to the first close above it; using wicks would give slightly deeper declines. These are observations on a single price series, with no margin of chance to calculate. Past data: it says nothing about the future.
The largest decline lasted a year, from 68,490 to 15,723. Getting back to the peak took a 335.6% rise, and 473 more days after the trough. From peak to recovery, 850 days went by.
Over five years, Bitcoin spent 60.2% of the time more than 20% below its last peak, and 30% of the time more than 50% below it. In this market, being far from the peak was the most common state.
What your position size changes
On your account, drawdown comes mostly from losing streaks. How deep it goes depends on what you risk per trade. Here is the drawdown left by a streak of consecutive losses:
| Losses in a row | 1% risk | 2% | 5% |
|---|---|---|---|
| 5 | 4.9% | 9.6% | 22.6% |
| 10 | 9.6% | 18.3% | 40.1% |
| 20 | 18.2% | 33.2% | 64.2% |
A streak of ten is nothing extreme. With 40% winning trades, over 200 trades, the median longest losing streak is nine.
I also simulated 20,000 runs of 200 trades of an imaginary method with zero expectancy: a one in three chance of hitting a target at 2 R, two in three of losing 1 R, with a fixed risk as a percentage of the balance. Its maximum drawdowns, by risk level:
| Risk per trade | Median max drawdown | Exceeded 1 time in 20 | Runs at 50% or more |
|---|---|---|---|
| 1% | 20.1% | 35.7% | less than 0.1% |
| 2% | 37.1% | 59.7% | 17.7% |
| 5% | 72.6% | 91.6% | 92.5% |
Even a method that loses nothing on average digs a hole in the account when you risk 5% per trade. At that level, 92.5% of runs lose half the account. At 1%, the median maximum drawdown drops to 20.1%, and stays below 35.7% in 19 runs out of 20: only the size changes. Percentage risk also drags the balance down. At 5%, a 2 R win followed by two 1 R losses nets zero in R, but leaves the account at 99.3%.
Limiting your drawdown
You cannot avoid losing streaks, but you can limit what they cost.
- Set your risk per trade with a cool head, and calculate your size from the stop, as in the 1% rule.
- Add up the risk of your open trades. Three positions that move together are one big risk. The 3-5-7 rule suggests an overall cap.
- Write a drawdown threshold into your trading plan. For example: at 10% below the peak, you cut your risk in half; at 20%, you stop and reread your journal. Choose your own numbers, but write them down beforehand.
- Track your drawdown in R in your trading journal, as well as in euros. Eight R below the peak says more than "a rough patch."
- Never increase your size to win it back. It is the fastest way to deepen a drawdown, and one of the signs of tilt.
Common mistakes
- Measuring from the deposit instead of from the peak. An account above its deposit can be in a deep drawdown.
- Thinking in euros. Losing €500 does not weigh the same on €2,000 as on €20,000.
- Judging a method on a period with no drawdown. Three good weeks tell you nothing about the losing streak to come.
- Forgetting duration. A drawdown is also counted in days below the peak: 850 for Bitcoin after November 2021.
- Believing a 30% rise erases a 30% decline. It takes 42.9%.
Training to withstand a streak
In TradaZen, the "Streaks and expectancy" unit teaches you to withstand a losing streak and to calculate a method's expectancy. The "Position size" unit shows you what is left of the account after several losses in a row.
In Training, you decide on real past charts, and your Simulated balance grows and shrinks with your reads. Your statistics track your Accuracy, your Mean R and your Streaks: you go through losing streaks without them costing you anything. To learn more, read the page on the trading simulator.
A simulator has its limits. It does not fully reproduce the emotion of real money, and a good read on a past chart says nothing about a future result. TradaZen places no orders, does not manage your money and gives no investment advice.
Frequently asked questions
What is drawdown in trading?
The decline of an account from its last peak, as a percentage of that peak. An account that climbed to €10,000 and then fell back to €8,500 is in a 15% drawdown. Maximum drawdown is the worst of these declines over a period.
How do you calculate drawdown?
Subtract the current value from the peak, then divide by the peak: (10,000 − 8,500) ÷ 10,000 = 15%.
What maximum drawdown should you accept?
No single number works for everyone. Set it with a cool head in your plan, along with what you will do if it is reached. In the simulation on this page, a zero-expectancy method lost half the account in 92.5% of runs at 5% risk per trade, versus less than 0.1% at 1%.
What rise do you need to recover from a 50% loss?
A 100% rise. After a 50% decline, the account is worth half its peak: it has to double to get back there. After a 20% decline, you need 25%; after 75%, you need 300%.
What is the difference between a drawdown and a loss?
A loss is measured on one trade. Drawdown is measured on the account, from its peak, and adds up several losses, including winnings given back. You can have no single big losing trade and still a deep drawdown, if small losses follow one another.
 Mehdi Azizi created TradaZen and published it on the App Store through the Devoria studio. The app's scenarios are real past charts, never made-up data.
TradaZen is a training tool: you play on past market data with a simulated balance. It is not a broker and not investment advice. Real trading carries a risk of capital loss.