TradaZen

In 20 seconds
- Definition
- The rules for your trades, written with a cool head, before the session.
- Contents
- Markets, timeframe, entry conditions, stop, target, size, stopping rules, review.
- Example
- 1% risk per trade, a target of at least 2 R, stop after three losses in the day.
- With the journal
- The plan says what you will do, the journal records what you did. The review compares the two.
- Trap
- Changing it during the session, right after a loss.
A trading plan fits on one page. It says what to trade, when to enter, where to exit, how much to risk and when to stop. You write it with a cool head, before the session, so you don't decide these things while the price is moving.
Its job is to make your method measurable. If every trade follows the same rules, your journal can tell you whether those rules hold up. Without a plan, you can't tell whether your losses come from the method or from the times you abandoned it. A plan does not, however, turn a method into a winning one.
This guide describes a training method, not investment advice. Trading carries a high risk of capital loss.
What a plan sets in advance
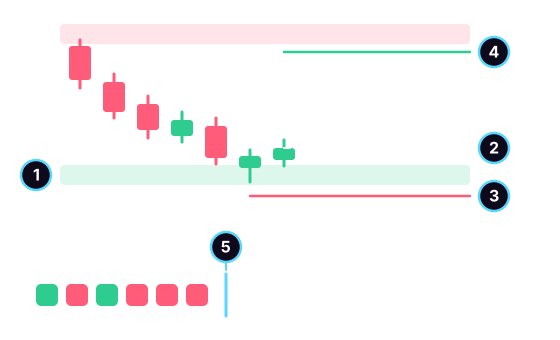
- The entry condition, written in advance: here, a rejection in a support zone.
- The entry.
- The stop, below the zone, where the idea is proven wrong.
- The target, before the next resistance, at twice the stop distance.
- The stopping rule: after three losses in a row, the session ends, even if other opportunities show up.
The first four markers describe a trade. The fifth describes the session. A plan that only talks about trades forgets the moment when you are the worst judge: the end of a losing streak.
The template to copy
A notebook, a note on your phone or a spreadsheet is enough. Fill in each line before the session, and don't change it during.
| Item | Example answer |
|---|---|
| Market | Bitcoin, nothing else |
| Timeframe | 4 hours, with the daily for context |
| When | evenings, 30 minutes max |
| Entry condition | rejection of support in an uptrend |
| No trade if | no clear place for the stop |
| Stop | below the low, plus a buffer |
| Target | before the next level |
| Minimum ratio | 2 R |
| Risk per trade | 1% of the account |
| Daily stop | three losses or 3% lost |
| Weekly stop | 6% lost |
| Review | Sunday, 15 minutes |
- Market and timeframe. One market to start, one decision timeframe. You recognize better what you see often.
- Entry condition. A sentence someone else could check on the chart. "When it looks like it's going up" can't be checked. "A candle that rejects support and closes above it, in an uptrend" can.
- No trade if. The list of cases where you stay out. The most useful one: when you can't find a clear point where your idea would be proven wrong.
- Stop and target. The stop goes where the idea is proven wrong, the target where the market has a reason to stall. The guide on the stop loss covers placement in detail.
- Minimum ratio. If the target isn't worth twice the risk, no trade. The math is in the guide on the risk/reward ratio.
- Risk per trade. A percentage of the account, from which you derive the position size. The math is in the 1% rule.
- Stops. A number of losses or an amount per day, then per week. Once you hit it, you close, no negotiating.
- Review. A fixed appointment to reread your journal and decide whether a rule needs to change.
The numbers in the template are an example, not a recommendation. Choose your own, write them down before the session, and don't touch them during.
The numbers behind each line
Each rule in the template answers a measured or published number.
- Risk per trade. At 1% per trade, ten losses in a row leave 90.4% of the account. At 5%, 59.9% is left.
- Losing streaks. With 40% winning trades, over 200 trades, the longest losing streak reaches eight or more three times out of four. Its median value is nine, according to a simulation of 20,000 runs of 200 trades. The stopping rule doesn't shorten these streaks. It keeps you from adding trades taken under emotion.
- The stop. Over five years of Bitcoin on 4-hour candles, a stop placed half a candle from the entry was hit in 72.3% of cases within 24 hours, across 10,844 entries taken with no analysis at all. Margin of chance at 95%: under one point. Past data: it says nothing about the future. The "below the low, plus a buffer" rule moves the stop away from that noise.
- The ratio. With a 2 R target, you need to be right more than one time in three to break even, before fees.
- The number of trades. In the AMF study published in 2014 by the Autorité des marchés financiers, the French market regulator, clients who had placed at least 250 orders over four years lost €18,741 on average. Beyond 5,000 orders, the average loss reached €75,394. A strict entry condition and a daily limit reduce the number of orders. The guide why traders lose covers the study in detail.
Linking it to the journal and the review
The plan says what you will do. The trading journal records what you did, and its first question is about the plan: "Were you within your plan?"
- Before the session, reread your plan. One minute is enough.
- During, take only the trades it allows. Doubt counts as a "no."
- After each trade, note in your journal whether you were within the plan, your reason for entering in one sentence, and the result in R.
- Each week, compare the results of trades within the plan with those outside it.
- Change one rule at a time, then watch for several weeks before changing another.
One week isn't enough to judge a rule: eight or nine losses in a row happen with a sound method. Judge over several dozen trades recorded in R.
Common mistakes
- A three-page plan. You don't reread it, so you don't follow it. One page, short sentences.
- Vague conditions that can be bent to justify any entry.
- Changing the plan during the session, usually right after a loss. It's one of the signs of tilt.
- Forgetting the "no trade" rule. Staying out is part of the plan, just like entering.
- Copying someone else's plan. Their markets, their hours and their tolerance for losses aren't yours.
- Judging the plan on one week's results instead of checking whether you followed it.
Practicing following a plan
In TradaZen, the "The plan and the journal" unit reminds you that a trade whose stop isn't decided before entry is a gamble, and you don't take it. The "Position size" unit teaches you to calculate the size that puts exactly 1% of the account at stake, stop included.
In Training, you read a real chart at a real date, with the rest hidden. You choose Long, Short or "I stay out," the app places the stop and the target, then the market reveals what it did, on a simulated balance. It's a good place to test a written entry condition: you apply it, or you stay out. The app's Journal lets you log your real trades in a few seconds, and you can export them to CSV for your review. To learn more, read the page on the trading simulator.
A simulator has its limits. It doesn't fully reproduce the emotion of real money, and a good read on a past chart says nothing about a future result. TradaZen places no orders, doesn't manage your money and gives no investment advice.
Frequently asked questions
What is a trading plan?
A page written before the session that sets your rules: which markets, which timeframe, when to enter, where to place the stop and the target, how much to risk and when to stop. It lets you decide with a cool head what you don't want to decide under the pressure of price.
What should you put in a trading plan?
At a minimum: the market, the timeframe, a checkable entry condition, the stop rule, the target rule and the minimum ratio, the risk per trade, the loss limits per day and per week, and when you review. The template on this page fits in twelve lines.
What's the difference between a trading plan and a trading journal?
The plan is written before: it says what you will do. The journal is written after each trade: it says what you did. The weekly review compares the two and shows you when you step outside your rules.
Does a trading plan guarantee results?
No. It limits the damage of a losing streak and makes your mistakes visible in your journal, without turning a method into a winning one. Trading still carries a high risk of capital loss, plan or no plan.
Do you need a different plan for scalping and swing trading?
The items stay the same. The answers change: the timeframe, the stop distance, the number of trades per session and the weight of fees. On very short timeframes, fees weigh more heavily, because the stop and the target are closer.
 Mehdi Azizi created TradaZen and published it on the App Store through the Devoria studio. The app's scenarios are real past charts, never made-up data.
TradaZen is a training tool: you play on past market data with a simulated balance. It is not a broker and not investment advice. Real trading carries a risk of capital loss.