TradaZen

In 20 seconds
- Definition
- Risk runs from the entry to the stop, the intended reward from the entry to the target. The ratio compares the two.
- Calculation
- For a long trade: (target − entry) ÷ (entry − stop).
- Example
- Buy at 100, stop at 98, target at 104: a ratio of 1 to 2, that is a 2 R target.
- Threshold
- With a 2 R target, you need to be right more than one time in three to break even, before fees.
- Trap
- The farther the target, the less often it gets hit.
Before you enter, you can know two things: how much you lose if your idea is wrong, and how much you aim for if it is right. The risk/reward ratio puts these two distances side by side. It is the first filter for a trade, even before the question of direction.
This guide describes a training method, not investment advice. Trading carries a high risk of capital loss.
How to calculate it
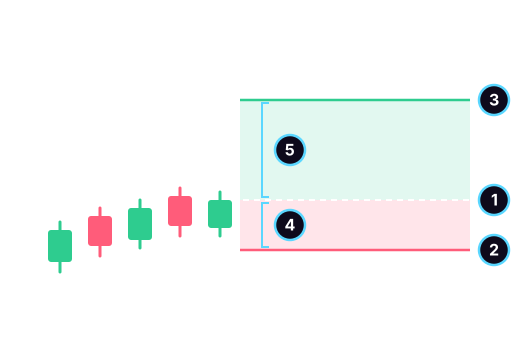
- The entry.
- The stop: the price where your idea becomes wrong.
- The target: the price where you plan to exit with a gain.
- The risk: from the entry to the stop. This is your "1 R."
- The intended reward: from the entry to the target, here twice the risk.
For a long trade, the calculation fits on one line:
ratio = (target − entry) ÷ (entry − stop)
Example: you buy at 100, your stop is at 98, your target at 104. You risk 2 to aim for 4. The ratio is 1 to 2, also written 1:2 or "2 R." For a short trade, flip it: the stop sits above the entry, the target below.
Watch the order of the numbers. Some people write 1:2 (risk first), others 2:1 (reward first). Talking in R avoids the confusion: a 2 R target is worth twice what you risk.
R, the unit that simplifies everything
R is what your stop costs you if it gets hit. A trade that reaches its 2 R target brings in twice what you were risking. A stopped-out trade costs 1 R. A trade cut halfway might be worth 0.8 R.
Counting in R rather than in euros has one advantage: your trades become comparable, whatever the size of the account or the market. A journal kept in R tells you whether your method holds up, not whether you had a good week. We cover this on the page about the trading journal.
The win rate you need
The ratio and the win rate work together. The farther your target, the less often you need to be right. The table gives the breakeven threshold, the share of winning trades below which the average turns negative, before fees:
| Target | Minimum win rate to break even |
|---|---|
| 1 R | 50% |
| 1.5 R | 40% |
| 2 R | 33.3% |
| 3 R | 25% |
| 4 R | 20% |
The calculation: threshold = 1 ÷ (1 + target in R). With a 2 R target, you can be wrong two times out of three and still break even, before fees.
To go further, the expectancy per trade is: win rate × average gain in R − loss rate × 1 R. With a 40% win rate and 2 R targets: 0.4 × 2 − 0.6 × 1 = 0.2 R per trade, on paper. Fees, the bid/ask spread and order slippage reduce that figure. And an average says nothing about any particular series of trades.
Why a big ratio is not enough
A 1 to 5 ratio looks attractive. But a target five times farther than the stop gets hit far less often. A ratio is judged together with the win rate, never on its own.
Two ways of dressing up a ratio will trap you:
- Moving the stop closer: the ratio goes up, but a stop that is too tight sits inside the normal noise of price. It gets hit before your idea has had time to play out.
- Pushing the target out for no reason: a target must match something on the chart: a previous high, a level already tested. Not a number that looks nice.
The right rule: the stop goes where your idea becomes wrong, the target where the market has a reason to stall. Then you calculate the ratio. If it is too low, you don't change the prices. You pass.
The ratio inside a method
- Set the stop first, where your idea becomes wrong: below the last swing low for a long, above the last swing high for a short.
- Find a logical target on the chart.
- Calculate the ratio. Below your threshold, for example 2 R, you don't enter.
- Calculate your position size from your risk. The 1% rule shows how.
- Move neither the stop nor the target during the trade, unless a rule written before entry says so.
- Record the R you got in your journal, then compare it with the planned R.
Common mistakes
- Cutting winners early and letting losers run: the planned ratio was 2 R, the real ratio falls below 1 R. It is the most costly mistake, and only a journal reveals it.
- Moving the stop when price gets close. The loss then exceeds the planned R, and it no longer has a limit. It is one of the signs of tilt.
- Forgetting fees: on short trades, they weigh heavily compared with R.
- Judging a ratio without the win rate: a ratio alone does not tell you whether a method holds up.
Candlestick patterns can be sorted with this filter. After a hammer or an engulfing pattern, the stop is often far away: the ratio decides whether the trade is worth it.
Practice judging a plan
In TradaZen, the "Manage your risk" unit teaches you to measure every trade in R. Some questions show you a plan on a real chart and ask: "Does this buy plan hold up?" Yes, or the target is too short, or the stop is too tight.
In Training, you choose Long or Short on a real chart whose continuation is hidden. The app sets the stop and the target, shows what you are putting at stake, and you confirm or change your mind. Then the market reveals what happened next, on a simulated balance. One rule is fixed in advance: if a candle touches both the stop and the target, the stop wins. To learn more, read the page about the trading simulator.
Frequently asked questions
What is a good risk/reward ratio?
There is no universal good ratio. Many traders set themselves a minimum of 1 to 2, because it leaves room on the win rate: one winning trade in three is enough to break even, before fees. What matters is the ratio together with how often your targets get hit.
How do you calculate the risk/reward ratio?
Divide the distance between the entry and the target by the distance between the entry and the stop. Buy at 100, stop at 98, target at 104: 4 ÷ 2 = 2. The ratio is 1 to 2.
What win rate do you need with a 1 to 2 ratio?
A little more than one winning trade in three, that is 33.3%, to break even before fees. In practice, fees and order slippage require a bit more.
Should you write 1:2 or 2:1?
Both exist, depending on whether the author puts risk or reward first. To avoid mistakes, talk in R: a 2 R target is worth twice what you risk.
 Mehdi Azizi created TradaZen and published it on the App Store through the Devoria studio. The app's scenarios are real past charts, never made-up data.
TradaZen is a training tool: you play on past market data with a simulated balance. It is not a broker and not investment advice. Real trading carries a risk of capital loss.