TradaZen
In 20 seconds
- Shape
- Small body at the top, long lower wick (at least 2 times the body), short or no upper wick.
- Where
- After a decline. With no decline before it, it is not a hammer.
- What it tells you
- Sellers pushed the price down, buyers brought it back before the close.
- Confirmation
- The next candle closes above the hammer's high.
- Invalidation
- The price falls back below the low of the wick.
The hammer is a candle with a small body at the top, a long lower wick and little or no upper wick. It only means something at the bottom of a decline. It tells the story of a period where sellers pushed the price far down, then buyers brought it back before the close.
It is often presented as a reversal signal. The numbers below call for caution: it is a clue, not a rule.
This guide describes a training method, not investment advice. Trading carries a high risk of capital loss.
How to recognize it
A candle tells the story of a period: its open, its close, its high and its low. The body is the distance between the open and the close. On a hammer, that body is small and sits at the top of the candle. Below it, the wick reaches far down: that is the lowest point the price touched before coming back up.
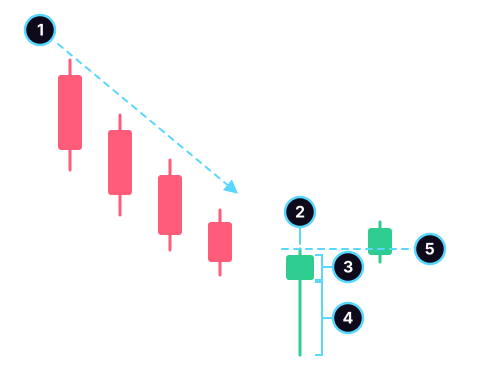
- The decline before it. Without it, it is not a hammer.
- The upper wick: short or absent.
- The body: from the open to the close.
- The lower wick: at least twice the body. Its tip is the low of the period.
- The confirmation: the next candle closes above the hammer's high.
The three criteria to check:
- A decline before it: a hammer only reads at the bottom of a move.
- A long lower wick, at least twice the height of the body.
- Little or no upper wick, whatever the color of the body.
What 5 years of Bitcoin show
I checked on real data, at the same horizon for every case. The question is simple: six and twelve candles after a hammer, was the price higher? And more often than after any down candle?
| After… | Cases | Price higher 6 candles later | Price higher 12 candles later |
|---|---|---|---|
| a hammer | 125 | 46.4% | 47.2% |
| a confirmed hammer | 38 | 42.1% | 57.9% |
| any down candle (baseline) | 4,500 | 54.2% | 53.3% |
Method: BTC/USDT, 4-hour candles, public exchange data, from January 1, 2021 to December 31, 2025, or 10,956 candles. Decline: close below the average of the last 20 closes and below the one from 10 candles earlier. Hammer: body of at least 10% of the candle, lower wick at least 2 times the body, upper wick at most half the body. Confirmed: the next candle closes above the hammer's high. Past data: it does not predict the future.
Confirmed or not, the hammer does not consistently beat a random down candle. Without confirmation, it does slightly worse. With confirmation, it reaches 58% at twelve candles, but on only 38 cases: at that sample size, the gap with the baseline stays within the margin of chance, give or take 16 points.
The hammer says that something happened at the bottom. What comes next is read from the rest of the chart: the underlying trend, the levels already touched, the size of the decline.
Hammer, hanging man, inverted hammer
Three candles look alike. The context, or where the wick sits, changes the name.
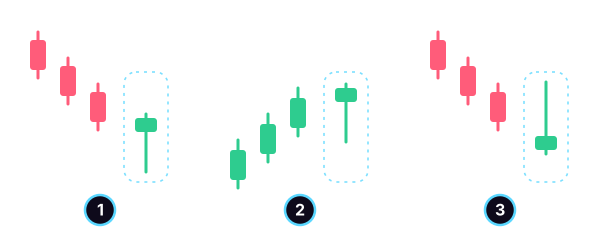
- The hammer: long lower wick, after a decline.
- The hanging man: same shape, but after a rise. It signals that sellers showed up at the top, nothing more.
- The inverted hammer: long upper wick, after a decline. Buyers tried to push higher, without holding.
A dragonfly doji, with an almost nonexistent body at the top of a long lower wick, also looks like a hammer. The difference is the body: the doji has almost none.
Trading it with a method
- Check the context. You need a real decline before the candle.
- Wait for the close. A wick still forming can disappear.
- Look for confirmation. The next candle closes above the hammer's high.
- Place your stop below the low of the wick: that is where the reading becomes wrong.
- Aim for at least twice your risk, so 2 R, or skip the trade. The math is explained in the guide on the risk/reward ratio.
- Log the trade in your journal, win or loss.
A long wick pushes the stop further away. For the same risk, your position must be smaller: the 1% rule shows how to calculate it.
Common mistakes
- Seeing hammers everywhere: a long wick in the middle of a rise is a hanging man, or nothing at all.
- Entering before the close, on a candle that is not finished.
- Forgetting the stop, because "the hammer announces a rise." The numbers above show that nothing is guaranteed.
- Increasing size to win it back after a losing hammer. It is one of the signs of tilt.
Practice on real hammers
The best way to learn to read a hammer is to read many of them, on real charts, without knowing what comes next. That is the exercise in the "The candle" unit of the TradaZen app: the chart stops on a real hammer, the rest is hidden, and you say what its wick is telling you.
In Training, you then decide: Long, Short or I stay out. Then the market reveals what it did, on a simulated balance. To see how it all works, read the page on the trading simulator or try a few trading exercises.
Your turn
Read real candles, just like in the app.
The same exercise as the "The candle" practice in the app, on real candles. What comes next is hidden.
Loading the exercise…
Charts: TradingView Lightweight Charts
Frequently asked questions
Is the hammer a buy signal?
No. Over five years of Bitcoin on 4-hour candles, the price was higher six candles after a hammer in 46% of cases, less than after any down candle. Confirmation does not clearly change that finding. The hammer shows a rejection of lower prices, nothing more.
What is the difference between a hammer and a hanging man?
The shape is the same. The hammer appears after a decline, the hanging man after a rise. The context gives it its name.
Is a red hammer worth less than a green hammer?
Color matters little. A green body says the close ended above the open, one extra detail. What makes a hammer is the length of the lower wick and the decline before it.
Which timeframe should you read it on?
Any of them, but a 4-hour or daily candle carries more trading than a 1-minute candle: its wick tells you more.
 Mehdi Azizi created TradaZen and published it on the App Store through the Devoria studio. The app's scenarios are real past charts, never made-up data.
TradaZen is a training tool: you play on past market data with a simulated balance. It is not a broker and not investment advice. Real trading carries a risk of capital loss.