TradaZen
In 20 seconds
- Four prices
- The open, the close, the high and the low of a period: one minute, four hours, one day.
- The body
- From the open to the close. Green if the close ends higher, red if it ends lower.
- The wicks
- Prices reached during the period, then given up before the close.
- What it tells you
- What happened over the period. Over five years of Bitcoin in 4-hour candles, a green candle did not signal another green: the color tended to alternate.
- Patterns
- Combinations of one to three candles, read only together with the trend and the surrounding levels.
A Japanese candlestick sums up one trading period. Four hours, one day or one minute: whatever its length, it gives four prices (the open, the close, the high and the low) and draws them so you can read them at a glance. It is the most common way to display price on trading charts.
The method comes from Japan's rice markets in the 18th century. It spread to the West in the early 1990s, through Steve Nison's books.
This guide describes a training method, not investment advice. Trading carries a high risk of capital loss.
Anatomy of a candlestick
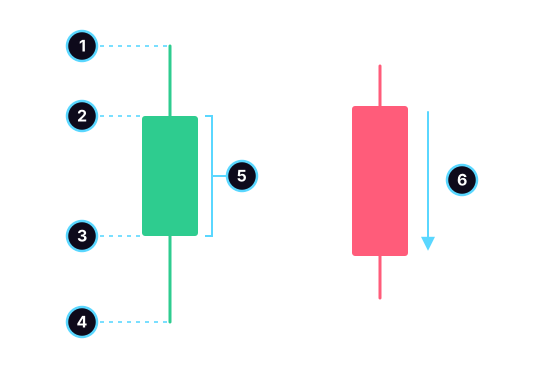
- The high: the highest price of the period, at the tip of the upper wick.
- The close, on a green candle: the top of the body. It is the last price of the period.
- The open, on a green candle: the bottom of the body. It is the first price of the period.
- The low: the lowest price, at the tip of the lower wick.
- The body, from the open to the close.
- The red candle: the same anatomy, the other way around. It opens at the top of the body and closes at the bottom, like the arrow.
Wicks are also called shadows. They show the prices the market reached during the period and then gave up: a long upper wick is a rally that didn't hold until the close.
Colors vary from one platform to another: green and red, white and black, hollow and filled. The principle stays the same. One color for a close above the open, another for a close below it.
In crypto, the market never closes: a candle almost always opens at the previous candle's closing price. In stocks, nights and weekends leave spaces between two candles, called gaps.
Reading a candle in three questions
- Who finished ahead? Look at the color and size of the body. A large body says one side led the period from start to finish. A tiny body is a doji: price came back to where it started.
- How far did price go? Look at the wicks. They tell you where price was rejected: at the top, at the bottom, or on both sides.
- Where is it? A candle is never read on its own. After what trend? At what level? Next to which other candles? A big candle after ten small ones doesn't tell the same story as a big one among other big ones.
A candle also depends on its timeframe. Six 4-hour candles make one daily candle, and they don't all move in the same direction as it does. The guide on how to read a stock chart measures by how much.
Pattern families
A pattern is a combination of candles that has been given a name. Patterns are grouped by number of candles.
- One candle: the doji, which hesitates; the hammer and the hanging man, with their long lower wick; the shooting star and the inverted hammer, with their long upper wick.
- Two candles: the engulfing pattern, where the second covers the first, and its opposite, the harami, where the second fits inside the first.
- Three candles: the morning star and evening star, then the three white soldiers and three black crows.
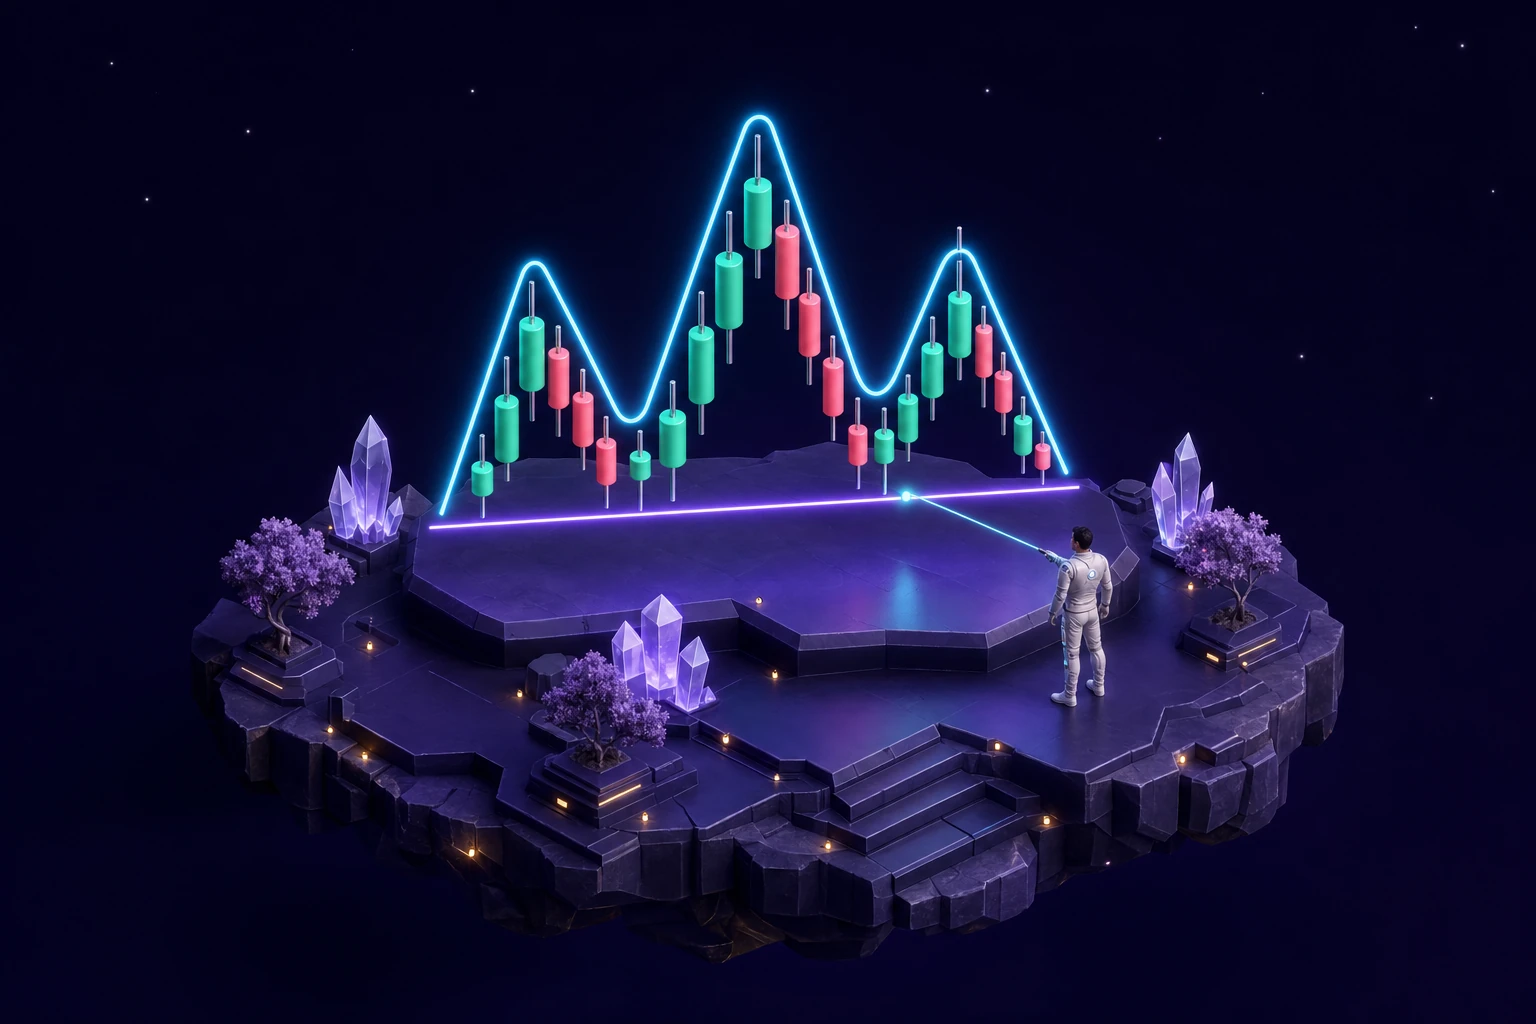
- Several dozen candles: chart patterns, such as head and shoulders, the double top or the triangle.
The candlestick pattern guides give their exact definition and what they produced over five years of Bitcoin. None of those I was able to measure clearly beat chance.
What 5 years of Bitcoin say
I asked five years of Bitcoin in 4-hour candles two simple questions. Does a candle's color say anything about the next one? And what share of candles has a long wick?
| After… | Cases | Next candle green |
|---|---|---|
| a green candle | 5,600 | 47.0% |
| a red candle | 5,355 | 55.5% |
| two greens in a row | 2,630 | 45.8% |
| three greens in a row | 1,204 | 43.7% |
| any candle (baseline) | 10,956 | 51.1% |
| Candle shape | Share of candles |
|---|---|
| decisive body | 38.6% |
| doji | 11.9% |
| long wick | 34.2% |
| of which lower wick | 18.7% |
| of which upper wick | 15.4% |
Method: BTC/USDT, 4-hour candles, Binance public data, from January 1, 2021 to December 31, 2025, or 10,956 candles. Green: close above the open; red: below. Decisive body: at least half of the candle, from high to low. Doji: body of at most 10% of the candle. Long wick: a wick of at least half of the candle. 95% margin of chance: about 1.3 points after a green or a red, 2 points after two greens, 2.8 after three, 0.9 for the baseline. Past data: it does not predict the future.
A green candle did not signal another green. On this data, it's actually the opposite: after a red, the next candle was green 55.5% of the time, versus 47.0% after a green. The gap is well beyond the margin of chance. The longer a streak runs, the more it tends to break: after three reds in a row, the next one was red only 42.5% of the time.
Don't take it as a signal. A gap of a few points, measured over thousands of candles, says nothing about the next one. It can vanish on another market, another period or another timeframe. What it shows is that the idea "green leads to green" doesn't hold on Bitcoin in 4-hour candles. Six candles after a green, price was higher only 49.4% of the time, versus 51.2% after any candle.
Long wicks are common: one candle in three has one. A wick alone doesn't make a pattern. That's why the hammer and the shooting star also require a specific trend before them. After a long lower wick, the next candle was green 47.4% of the time, over 2,050 cases: less often than the average, 51.1%.
Reading it with method
- Pick the timeframe first. A one-minute candle and a daily candle don't carry the same amount of trading.
- Wait for the close. Until the candle is finished, its color, body and wicks can still change completely.
- Read the body, then the wicks, then the context, in that order.
- Compare it with its neighbors. A candle is only big or small relative to the others.
- Find where your idea becomes wrong. A candle's high or low often gives you the place for the stop loss.
- Write your reading in your journal, even when you stay out.
Common mistakes
- Reading a candle that hasn't closed. A big green candle halfway through the period can end as a doji.
- Giving meaning to color alone. Over five years of Bitcoin, it did not signal the next color.
- Comparing candles from different timeframes, such as a one-minute candle and a daily candle.
- Learning thirty pattern names before you can read a single candle.
- Confusing the wick and the body. The engulfing pattern and the harami are judged on the bodies, not the wicks.
Practice reading a candle
TradaZen's "The candle" unit trains this reading on real charts. One question is about the body: "The body of the last candle: decisive or hesitant?" You answer, then the app shows you the body's share of the candle. Another exercise stops the chart on a real hammer, with what came next hidden, and asks what its wick is telling you.
In Training, each scenario is a real past chart, stopped at a real date. You choose Long, Short or "I stay out", then the market reveals what it did, on a simulated balance. To see how it all works, read the page on the trading simulator or try a few trading exercises.
Frequently asked questions
How do you read a Japanese candlestick?
Look at the body first: its color tells you whether the period ended higher or lower than it started, its size tells you how clearly. Then look at the wicks, which show prices reached and then given up. Finally, place the candle within the trend and near the levels.
What does a green or red candle mean?
A green candle closed above its open: price ended the period higher. A red one closed below. Over five years of Bitcoin in 4-hour candles, a candle's color did not signal the color of the next one.
What is the difference between the body and the wick?
The body runs from the open to the close. The wicks extend the body up to the high and down to the low of the period. The body tells you where price ended, the wicks how far it went.
Are candlestick patterns reliable?
A candle sums up exactly what happened. The candlestick patterns I measured over five years of Bitcoin did not clearly beat chance. They help you describe the market and place a stop.
Which patterns should you learn first?
Start with one-candle patterns: the doji, the hammer, the shooting star. They teach you to read a body and a wick, and every other pattern is built from those two elements.
 Mehdi Azizi created TradaZen and published it on the App Store through the Devoria studio. The app's scenarios are real past charts, never made-up data.
TradaZen is a training tool: you play on past market data with a simulated balance. It is not a broker and not investment advice. Real trading carries a risk of capital loss.