TradaZen
In 20 seconds
- Shape
- Small body at the bottom, long upper wick (at least 2 times the body), short or no lower wick.
- Where
- After a rise. After a decline, the same candle is called an inverted hammer.
- What it tells you
- Buyers pushed the price up, sellers brought it back before the close.
- Confirmation
- The next candle closes below the shooting star's low. Over five years of Bitcoin, even confirmed, it did no better than any other candle.
- Invalidation
- Price moves back above the tip of the upper wick.
The shooting star is a candle with a small body at the bottom, a long upper wick, and little or no lower wick. It only means something at the top of a rise. It tells the story of a period where buyers pushed the price far up, then sellers brought it back near the open before the close.
It is the mirror image of the hammer. It is often presented as a bearish reversal signal. The numbers below say you should be wary of it.
This guide describes a training method, not investment advice. Trading carries a high risk of capital loss.
How to spot it
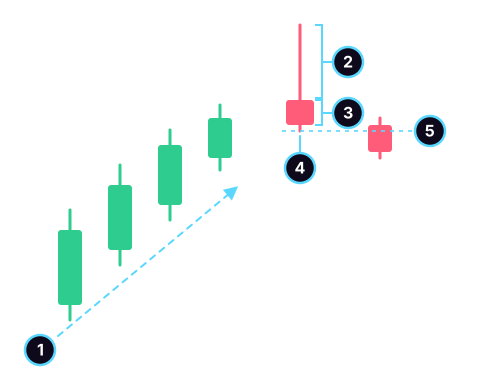
- The rise before it. Without it, it is not a shooting star.
- The upper wick: at least twice the body. Its tip is the high of the period.
- The body: small, at the bottom of the candle.
- The lower wick: short or absent.
- Confirmation: the next candle closes below the low of the shooting star.
The three criteria to check:
- A rise before it: a shooting star only reads at the top of a move.
- A long upper wick, at least twice the height of the body.
- Little or no lower wick, whatever the color of the body.
The body can be red or green. Of the 93 shooting stars I counted below, 37 had a red body and 56 a green one. A red body only says the close ended below the open, one extra detail.
Shooting star, inverted hammer, evening star
These three names come up together and are often confused. Two are the same candle; the third is a three-candle pattern.
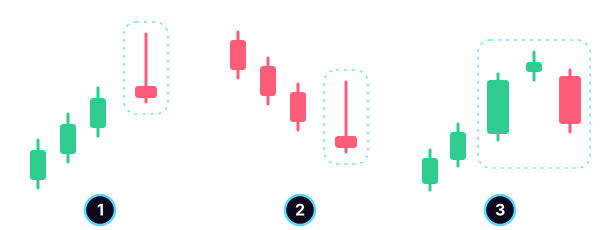
- The shooting star: long upper wick, after a rise.
- The inverted hammer: the same shape, after a decline. Buyers tried to push higher and could not hold. It reads as a decline that is starting to hesitate.
- The evening star: three candles after a rise. A large green one, a small hesitant candle, then a large red one that closes below the middle of the first candle's body.
The small middle candle of an evening star is sometimes a shooting star. Both tell of buyers stalling at the top, but the evening star also needs a large green candle before and a large red one after.
A gravestone doji, with an almost nonexistent body at the bottom of a long upper wick, also looks like a shooting star. The difference is the body: the doji has almost none.
What 5 years of Bitcoin say
I flagged every shooting star and every inverted hammer over five years of Bitcoin, then looked at where the price was six and twelve candles later. For the shooting star, the expected direction is down: a lower price afterward.
| After… | Cases | Lower after 6 candles | Lower after 12 candles |
|---|---|---|---|
| a shooting star | 93 | 44.1% | 44.1% |
| a confirmed shooting star | 35 | 40.0% | 37.1% |
| an uptrend candle (baseline) | 4,760 | 51.9% | 49.5% |
For the inverted hammer, the expected direction is up.
| After… | Cases | Higher after 6 candles | Higher after 12 candles |
|---|---|---|---|
| an inverted hammer | 57 | 50.9% | 52.6% |
| a downtrend candle (baseline) | 4,467 | 54.1% | 53.1% |
Method: BTC/USDT, 4-hour candles, public exchange data, from January 1, 2021 to December 31, 2025, for a total of 10,956 candles. Shooting star: body at least 10% of the candle, upper wick at least 2 times the body, lower wick at most half the body. Uptrend: close above the average of the last 20 closes and above the close from 10 candles earlier; downtrend: the opposite. Inverted hammer: the same shape, after a downtrend. Confirmed: the next candle closes below the low of the shooting star, or above the high of the inverted hammer; the measurement then starts from that close. 95% margin of chance: about 10 points for the shooting star, 16 for its confirmed version, 13 for the inverted hammer, 1.5 for the baselines. Past data: they do not predict the future.
The shooting star does not beat the baseline. Six candles later, the price was lower in 44.1% of cases, versus 51.9% after any uptrend candle. The gap stays within the margin of chance, but it points the wrong way: after a shooting star, the rise more often continued than reversed.
Confirmation does not help: 40.0% after six candles, 37.1% after twelve, over 35 cases. With a stricter definition, an upper wick at least three times the body, only 42 shooting stars remain, and the finding does not change: 45.2% after six candles.
The inverted hammer is on par with the baseline: 50.9% versus 54.1%. Confirmed, I found only 6 in five years, too few to give a figure.
One caveat: this is a single market, a single timeframe, and a period when Bitcoin had long rises. On this data, the shooting star says something happened at the top. It does not say the rise is over.
Trading it with a method
- Check the context. You need a real rise before the candle.
- Wait for the close. A wick that is still forming can disappear.
- Look for confirmation, knowing it did not improve the numbers on Bitcoin. The next candle closes below the star's low.
- Place your stop above the tip of the upper wick: that is where the reading becomes wrong.
- Aim for at least twice your risk, or pass. The math is laid out in the guide on the risk/reward ratio.
- Log the trade in your journal, win or loss.
A long wick pushes the stop further away. For the same risk, your position must therefore be smaller: the 1% rule shows how to size it. If the shooting star lands on a previous high, the support and resistance guide helps you judge that level.
Common mistakes
- Seeing shooting stars everywhere: a long upper wick in the middle of a decline is an inverted hammer, or nothing at all.
- Entering before the close, on a candle that is not finished.
- Confusing it with the evening star, which needs three candles.
- Fading a strong rise because a wick appeared. Over five years of Bitcoin, the rise is what most often continued.
- Placing the stop in the middle of the wick to tighten it: price just traded there and can come back without your reading being wrong.
Practice reading a wick
TradaZen's "The candle" unit has you read real wicks on real charts: the chart stops on a real hammer, what follows is hidden, and you say what its wick is telling you. A shooting star reads the same way, upside down.
In Training, you then decide: Long, Short, or I stay out. The app sets the Stop and the Target, then the market reveals what it did, on a Simulated balance. To see how it all works, read the page on the trading simulator or try a few trading exercises.
Frequently asked questions
What is a shooting star candlestick?
It is a candle with a small body at the bottom, a long upper wick at least twice the body, and little or no lower wick, appearing after a rise. It shows that price climbed during the period, then fell back before the close.
What is the difference between a shooting star and an inverted hammer?
The shape is the same. The shooting star appears after a rise, the inverted hammer after a decline. The context gives it its name.
What is the difference between a shooting star and an evening star?
The shooting star is a single candle. The evening star is a three-candle pattern: a large green one, a small one, a large red one. The small middle candle can be a shooting star.
Is the shooting star a sell signal?
No. Over five years of Bitcoin on 4-hour candles, price was lower six candles after a shooting star in 44.1% of cases, less than after any uptrend candle (51.9%). Confirmed, it did no better. It shows a rejection of higher prices, nothing more.
Does the color of the shooting star matter?
Not much. A red body says the close ended below the open, one extra detail. What makes a shooting star is the length of the upper wick and the rise before it.
 Mehdi Azizi created TradaZen and published it on the App Store through the Devoria studio. The app's scenarios are real past charts, never made-up data.
TradaZen is a training tool: you play on past market data with a simulated balance. It is not a broker and not investment advice. Real trading carries a risk of capital loss.