 TradaZen
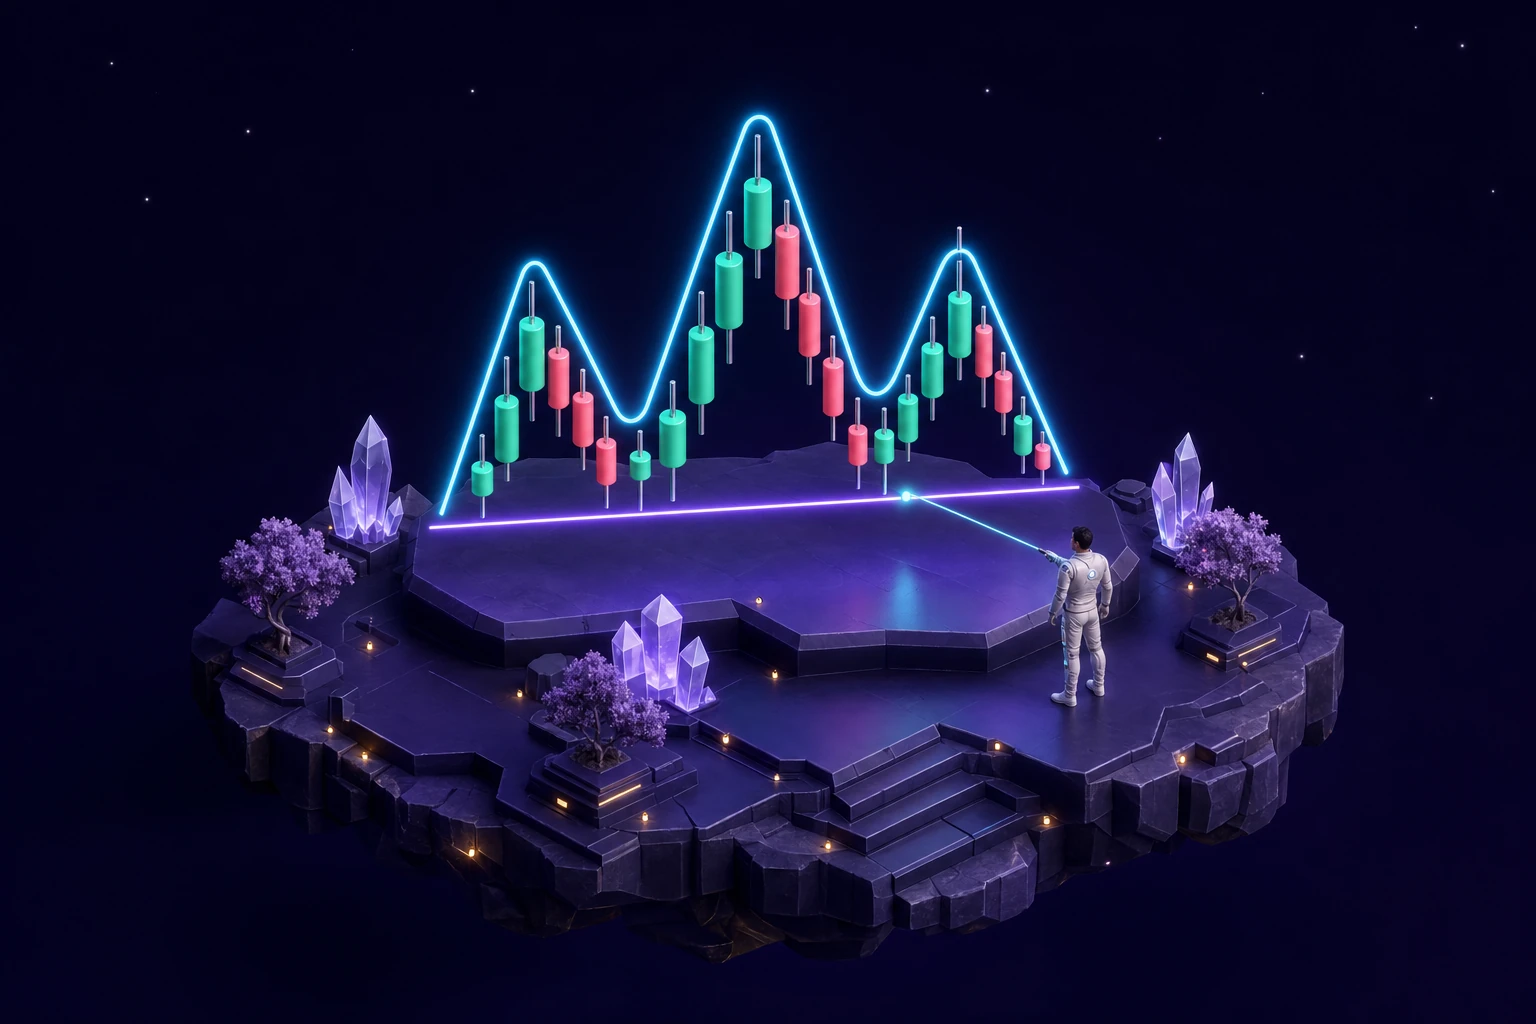
In 20 seconds
- Definition
- A price zone where the market has already reacted several times: declines stopped there (support) or rallies stalled there (resistance).
- Where
- At previous lows and highs, round numbers, the top and bottom of a range.
- What it tells you
- That buyers or sellers acted at that price. Not that they will act again.
- Confirmation
- A clear close beyond the level says more than a wick. On five years of Bitcoin, neither the bounce nor the breakout did better than any random candle.
- Invalidation
- For a buy at support: a clear close below the zone. Your stop goes beyond the level, not on it.
Support is a price where a decline has already stopped. Resistance is a price where a rally has already stalled. You see them on any chart, often without looking: lows that line up, highs at the same height.
They are usually described as walls. Price is supposed to bounce off support and stall below resistance. I tested that idea on five years of Bitcoin, and it does not hold up. A level is still genuinely useful, though: it tells you where your idea is proven wrong.
This guide describes a training method, not investment advice. Trading carries a high risk of capital loss.
What support is, what resistance is
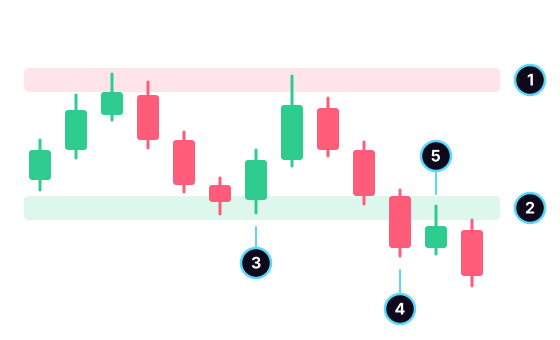
- Resistance: a zone where rallies have stalled several times.
- Support: a zone where declines have stopped several times.
- A test: the wick enters the zone, the close stays above it.
- The breakout: a clear close below support.
- The retest: price comes back up to the old support and stalls below it. This is called support turning into resistance.
A price matters because people remember it. Those who bought at a low sometimes buy again at the same spot. Those who missed the move wait for a pullback. Those who bought too high sell when price returns to their entry. None of this is guaranteed: these are crowd habits, and a crowd changes its mind.
Drawing them without fooling yourself
- Draw zones, not lines. A level rarely plays out to the cent. Use the width of the wicks that stopped there.
- Count the touches. A price touched only once is not a level yet. Two clean touches are worth more than five rough ones.
- Start from the highest timeframe. A level visible on the daily chart carries more weight than a 15-minute level. Then move down to refine it.
- Favor recent levels. A low from three years ago matters less than a low from last week.
- Watch round numbers: 100, 1,000, 50,000. Many orders sit there, simply out of habit.
- Stop at two or three levels. A chart covered in lines always offers one to justify any trade.
What 5 years of Bitcoin show
I asked the same question as for candlesticks. After a level was touched, did price move in the expected direction more often than after any candle taken in the same situation?
At support, the expected direction is a bounce: a higher price six or twelve candles later.
| At support | Cases | Higher 6 candles later | Higher 12 candles later |
|---|---|---|---|
| support touched and holding | 196 | 56.1% | 53.6% |
| support broken on a close | 177 | 56.5% | 56.5% |
| any candle in a downtrend (baseline) | 4,468 | 54.1% | 53.1% |
At resistance, the expected direction is a pullback: a lower price afterward.
| At resistance | Cases | Lower 6 candles later | Lower 12 candles later |
|---|---|---|---|
| resistance touched and holding | 292 | 52.7% | 47.9% |
| resistance broken on a close | 239 | 48.5% | 48.1% |
| any candle in an uptrend (baseline) | 4,760 | 51.9% | 49.5% |
Method: BTC/USDT, 4-hour candles, public Binance data, from January 1, 2021 to December 31, 2025, for a total of 10,956 candles. Support: the lowest low of the previous 50 candles, about eight days. Zone: that low, plus a quarter of the average candle range (the 14-candle ATR). Touched and holding: the wick enters the zone, the close stays above support, and the previous candle was not in it. Broken: the close moves below support, the previous one was above it. Resistance: the mirror image, using the highest high of the 50 candles. Downtrend: close below the average of the last 20 closes and below the close 10 candles earlier; uptrend: the opposite. 95% margin of chance: about 7 points on the support rows, 6 on the resistance rows, 1.5 on the baselines. Past data: it does not predict the future.
A touched level held no better than chance. At support, the bounce beats the baseline by two points at six candles, well within the margin. At resistance, the gap is no more than one point at six candles, and it reverses at twelve.
The breakout did not predict what came next either. After a close below support, price was higher six candles later in 56.5% of cases, just like after any candle in a downtrend.
Using the lowest low and highest high of the last 100 candles, the conclusions stay the same. This is only one definition among others, drawn by a program and not by eye. It is enough to show that a level alone does not predict price. It is a clue, not a rule.
So what is a level for
A level does not tell you where price is going. It tells you where your idea is proven wrong, and your plan starts there.
- Your stop goes beyond the level, not on it. If you buy near support, your idea is wrong when price closes clearly below it. Your stop goes under the zone, with room for wicks.
- Your target goes before the next level. Buying just below nearby resistance leaves little room. Measure the distance to it, compare it to your stop, and work out your risk/reward ratio.
- In the middle, there is nothing to read. Between two levels, price can go anywhere. That is often the place to stay out.
- Position size comes next, based on the distance to your stop. The 1% rule shows the calculation.
A candle is also read together with the level where it appears. A hammer on an old support does not say the same thing as a hammer in the middle of nowhere, even though neither is enough to decide.
Common mistakes
- Drawing the level after the fact, once the bounce is visible. On the right side of the chart, where you make your decision, the bounce has not happened yet.
- Buying because price touches support. A touch is not enough: the numbers above show it.
- Placing your stop exactly on the level. Wicks pierce it before moving on, and your stop gets hit by a few points.
- Moving the level to stay right when price breaks through it. A broken level is a broken level.
- Drawing too many lines, until you find one that suits you.
Practice reading levels
In TradaZen, the "Range" unit teaches you to read a market moving back and forth between two boundaries. In the first two lessons, the app draws support and resistance on the chart and labels them. In the third, it leaves only the drawings. In the fourth, nothing at all: it is up to you to spot them.
While deciding, you can draw a horizontal line or a rectangle on the chart yourself. Then you choose Long, Short, or "I stay out". If you enter, the app places the Stop and the Target, and the market reveals what happened next, on a simulated balance. To learn more, read the page on trading exercises.
Frequently asked questions
What is the difference between support and resistance?
Support is a zone below price where declines have stopped several times. Resistance is a zone above price where rallies have stalled. Both mark prices where the market has already reacted, with no guarantee it will react again.
How do you draw support and resistance?
Find the lows and highs where price has turned around at least twice, starting from the highest timeframe. Draw a zone covering those wicks rather than a line to the cent. Keep two or three levels, the most recent and the clearest.
Does broken support become resistance?
Sometimes. When price comes back up to an old support from below, it may stall there: this is called role reversal. Nothing forces it to. On five years of Bitcoin, a support break did not even signal further downside more often than chance.
How many times does a level need to be touched?
Two clean touches are enough to call it a level. A price touched only once is not one yet. Beyond that, each touch makes the level more visible, without guaranteeing it will hold the next time.
 Mehdi Azizi created TradaZen and published it on the App Store through the Devoria studio. The app's scenarios are real past charts, never made-up data.
TradaZen is a training tool: you play on past market data with a simulated balance. It is not a broker and not investment advice. Real trading carries a risk of capital loss.
