 TradaZen

In 20 seconds
- Shape
- Three peaks: a shoulder, a higher head, a second shoulder close in height to the first.
- Where
- After an uptrend for the head and shoulders, after a downtrend for the inverse head and shoulders.
- What it tells you
- The uptrend can no longer make new highs, and the floor formed by the two troughs eventually gives way.
- Confirmation
- A close below the neckline. Before that, there is no pattern, just three peaks.
- Invalidation
- Price moves back above the right shoulder, then above the head.
The head and shoulders is the best-known chart pattern. Traders often shorten it to H&S. It tells the story of an uptrend running out of steam: a peak, a higher peak, then a peak that can't get there anymore.
It is easy to see in hindsight. On the right edge of the chart, where you have to decide, it is much less clear. Here you'll see how to recognize it, where it gets confirmed, and why I don't publish any statistics on it.
This page describes a training method, not investment advice. Trading carries a high risk of capital loss.
Recognizing it
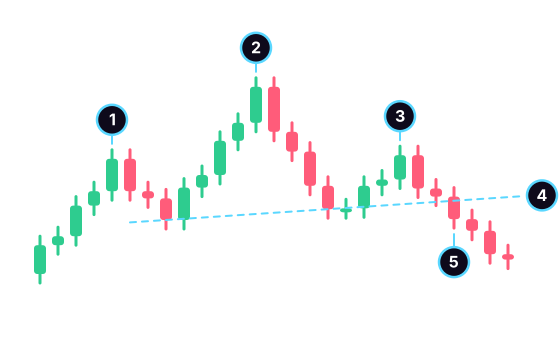
- The left shoulder: a first peak at the end of an uptrend.
- The head: a higher peak.
- The right shoulder: a peak lower than the head, at roughly the same height as the left shoulder.
- The neckline: the line connecting the two troughs on either side of the head.
- The breakout: the first close below the neckline.
The neckline doesn't have to be horizontal. It slopes up or down a little, depending on the height of the two troughs. The shoulders don't need to be identical, but they must stay clearly below the head.
The inverse head and shoulders is the mirror image: three troughs, the deepest in the middle, after a downtrend. It is confirmed by a close above the neckline.
What it tells you
At the left shoulder, the uptrend carries on normally. At the head, buyers push even higher, then price falls back to the level of the first trough. At the right shoulder, they can no longer get past the previous peak. The market is making lower highs: the uptrend has lost its rhythm.
As long as the neckline holds, nothing is settled. It acts as support, and price can bounce off that floor, as it already has twice. The breakout only tells you the floor has given way.
What the textbooks take from it
- Entry: on the close below the neckline, or when price comes back up to retest it from below, if it does.
- Stop: above the right shoulder. That is where the idea of an exhausted uptrend is proven wrong.
- Theoretical target: the height of the pattern, from the head to the neckline, projected down from the breakout point. It is a calculation convention, not a forecast. It helps you judge whether the trade is worth its risk.
Example: head at 110, neckline at 100, right shoulder at 105, sell on the breakout at 100. The theoretical target is 90. With a stop at 106, just above the right shoulder, you risk 6 to aim for 10: a ratio of 1 to 1.7. With a stop above the head, at 111, you risk 11 to aim for 10, less than 1 to 1. The risk/reward ratio settles it quickly.
Why I don't publish a number
For candlesticks, I could write a simple definition and count occurrences over five years of Bitcoin. For the head and shoulders, I tried, on the same data: BTC/USDT on 4-hour candles, from 2021 to 2025. A program finds the peaks and troughs, then looks for five points in the right order, with shoulders of similar height and a close below the neckline.
The problem is the settings. You have to decide how big a pullback must be for a peak to count, and how much two shoulders can differ. Depending on those choices, I found between 8 and 83 patterns per direction in five years. With so few cases, the margin of chance ranges from 11 to more than 30 points. And the results shifted sharply from one setting to another.
When the result depends on the chosen setting, the measurement proves nothing: you could keep tuning until you get the number you want. I'd rather publish nothing. The doji, the hammer and the engulfing pattern do have their numbers on this site.
Hold the success rates you read elsewhere to the same standard. Ask which market, which period, which definition and how many cases.
Common mistakes
- Seeing the pattern before it exists. Until the right shoulder is finished and the neckline is broken on a close, all you have is three peaks.
- Entering on a wick below the neckline without waiting for the close.
- Treating the theoretical target as a promise. Price has no obligation to get there.
- Ignoring context. A head and shoulders in the middle of a range has no uptrend to reverse.
- Placing the stop above the head to be safe without recalculating the ratio. The trade is often no longer worth its risk.
Practice deciding before you know
TradaZen doesn't label head and shoulders patterns. Training works on what this pattern demands: deciding on the right edge of the chart, while what comes next is hidden. While you decide, you can draw a trendline to mark your neckline, or a horizontal line at the right shoulder.
You choose Long, Short, or "I stay out." The app sets the Stop and the Target, then the market reveals what it did, on a simulated balance. The "Breakout" unit teaches you to tell a real range breakout from a false start, the same question a neckline asks. To learn more, read the page on the trading simulator.
Frequently asked questions
What is a head and shoulders in trading?
A three-peak pattern after an uptrend: a shoulder, a higher head, then a shoulder lower than the head. It is confirmed when price closes below the neckline, the line connecting the two troughs.
How do you calculate a head and shoulders target?
Measure the height between the head and the neckline, then project it down from the point where price broke the line. Head at 110, neckline at 100: the theoretical target is 90. This calculation convention predicts nothing.
What is the difference between a head and shoulders and an inverse head and shoulders?
The head and shoulders appears after an uptrend, with three peaks, the highest in the center. The inverse appears after a downtrend, with three troughs, the deepest in the center. The first is confirmed below the neckline, the second above it.
Is the head and shoulders reliable?
No one can say without a precise definition. Searching for it with a program over five years of Bitcoin, I found too few patterns, and results too dependent on the settings, to publish a rate. Be wary of success percentages given without a market, a period or a number of cases.
 Mehdi Azizi created TradaZen and published it on the App Store through the Devoria studio. The app's scenarios are real past charts, never made-up data.
TradaZen is a training tool: you play on past market data with a simulated balance. It is not a broker and not investment advice. Real trading carries a risk of capital loss.
