 TradaZen
In 20 seconds
- Definition
- Levels drawn between the low and the high of a clear move, at 23.6, 38.2, 50, 61.8 and 78.6% of its height.
- Origin
- The 0.382 and 0.618 ratios come from the Fibonacci sequence. The 50% does not: it was added out of habit.
- Drawing
- From low to high for a pullback in a rise, from high to low for a bounce in a fall.
- What I measured
- Over five years of Bitcoin, price reactions were no more frequent near the three levels than next to them.
- Trap
- Choosing the move after the fact, until a level lands exactly on the low.
The Fibonacci retracement is one of the most widely used drawing tools. You pick a clear move, drag the tool from the low to the high, and the chart fills with lines: 38.2%, 50%, 61.8%. The idea is that a pullback often stops on one of them.
I checked whether price reacts more often at these levels than at nearby prices. Over five years of Bitcoin, the answer is no. The method has limits, and I give them along with the numbers.
This guide describes a training method, not investment advice. Trading carries a high risk of capital loss.
Where the levels come from
The Fibonacci sequence starts with 0 and 1, then each number is the sum of the two before it: 1, 2, 3, 5, 8, 13, 21, 34, 55, 89. The further you go, the closer the ratio between two neighboring numbers gets to 0.618: 55 ÷ 89 = 0.618. A number divided by the one two places after it gives 0.382: 34 ÷ 89 = 0.382. The 23.6% comes from a jump of three places: 21 ÷ 89 = 0.236.
The 50% does not come from the sequence. It was added because a pullback of half a move makes sense to everyone. The 78.6% is the square root of 0.618.
These ratios have a mathematical origin, which says nothing about the orders placed in a market. If the levels matter, it is because many traders watch them and place their orders there. That hypothesis can be tested.
How to draw a retracement
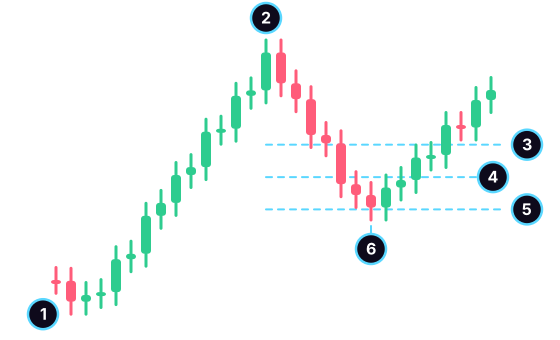
- The low, start of the clear move.
- The high, its end.
- The 38.2% level: the pullback erases 38.2% of the rise.
- The 50% level.
- The 61.8% level.
- The reaction: the pullback stops and price moves on again.
To draw it:
- Pick a clear move: a decisive rise or fall, with a low and a high that anyone would see.
- Drag the tool from the start to the end of the move: from low to high for a rise, from high to low for a fall. Use wicks or closes, but always the same one.
- Read the levels: 38.2% for a shallow pullback, 50% for a medium one, 61.8% for a deep one.
- Look at what lines up: a former support or resistance, a round number, a trendline.
Example: price rises from 100 to 150. The move is 50. The 38.2% level is at 150 − 19.1, so 130.9; the 50% at 125; the 61.8% at 150 − 30.9, so 119.1.
What 5 years of Bitcoin show
A pullback always ends somewhere, and with three levels on the chart, it has a good chance of ending near one of them. To know whether these levels matter, you have to compare them with the prices next to them.
A program finds every clear move, then every reaction during the pullback that follows: a new low, followed by a bounce of at least 1.5%. For each reaction, it calculates the share of the move already erased. Around each level, it draws a band two points wide on each side, for example from 59.8 to 63.8% for the 61.8%, plus two neighboring bands of the same width, just above and just below. If the level matters no more than its neighbors, its band gets about one third of the reactions in these three bands.
| Clear move of at least | Bounce of at least | Reactions counted | In the level's band |
|---|---|---|---|
| 8% | 1.5% | 578 | 33.2% |
| 8% | 2.5% | 338 | 33.7% |
| 12% | 1.5% | 417 | 34.3% |
| 12% | 2.5% | 260 | 36.2% |
Method: BTC/USDT, 4-hour candles, public Binance data, from January 1, 2021 to December 31, 2025, or 10,956 candles. Clear move: a rise or fall of at least 8% (or 12%) without a pullback of the same size, identified on highs and lows. Pullback: the following move, up to its extreme. The bounce is read on the candles after the low, so as not to guess the order of prices inside a candle. Reactions counted: those falling in one of the nine bands, out of 1,203, 709, 888 and 540 reactions in total depending on the setting. With no effect from the levels, the central band gets 33.3%. 95% margin of chance: 4 to 6 points depending on the row. Past data: it does not predict the future.
The levels did not attract more reactions than their neighbors. With 8% moves and 1.5% bounces, the levels' band got 33.2% of the reactions, against an expected one third. All four settings stay between 33.2 and 36.2%, each time within the margin. With bands one point wide instead of two, the shares range from 29.8 to 34.5%, still within the margin. Three levels drawn at random between 25 and 75%, counted the same way, do just as well on average.
For the end of pullbacks, I can't draw a conclusion. The point where the pullback stops for good is the one that matters most to a trader. There are only 148 in five years with 8% moves, and 63 with 12% moves. Once narrowed down to the bands around the levels, too few remain: the margin exceeds 10 points, and the result flips direction from one setting to the next. I don't publish these numbers.
This measurement has its limits. The program picks moves in a fixed way, whereas you pick the ones you see, and it does not check whether a level falls on a former support. The result only shows that, drawn systematically over five years of Bitcoin, Fibonacci levels don't stand out from the prices next to them. It is a clue, not a rule.
So what is the tool for?
It gives a common measure to describe a pullback. "Price erased half of the rise" says more than "it dropped a lot." A pullback that erases a quarter of the move leaves the rise almost intact; a pullback that erases nearly all of it no longer looks like a pause.
To decide, go back to the usual reference points. Your stop goes behind the low of the pullback, or behind the start of the move if you accept a wider risk. Your target sits before the previous high. The risk/reward ratio then tells you whether the trade is worth its risk, and the 1% rule gives you the size.
Common mistakes
- Choosing the move after the fact, until a level lands exactly on the low. On a finished chart, there is always a move that "works."
- Piling on levels: 23.6, 38.2, 50, 61.8, 78.6, then the extensions beyond 100%. With seven lines, price almost always touches one.
- Buying at the level without a stop, counting on the bounce. A level stops nothing by itself.
- Switching endpoints from one reading to the next: wicks one day, closes the next.
- Treating a level as an exact price. Even for those who believe in it, it is a zone, and your stop needs to leave room for wicks.
Practice reading a pullback
TradaZen does not draw Fibonacci levels. The "The pullback" unit trains you on the same moment, price coming back within a trend: the 20-period moving average serves as a guide in the first lessons, then it disappears. While deciding, you can draw a horizontal line on a level you calculated yourself, or on the low of the pullback.
You choose Long, Short, or "I stay out." The app places the stop and the target, then the market reveals what it did, on a simulated balance. To learn more, read the page on trading exercises.
Frequently asked questions
How do you draw a Fibonacci retracement?
Find a clear move, with an obvious low and high. Drag the tool from low to high for a rise, from high to low for a fall. The 38.2%, 50% and 61.8% levels place themselves, measured from the high.
Why 61.8%?
Because the ratio between two neighboring numbers in the Fibonacci sequence tends toward 0.618, the inverse of the golden ratio. The number has a mathematical origin. Nothing shows that price reacts there more than anywhere else.
Should you draw Fibonacci on wicks or on closes?
Both are done. Wicks give the extremes of the move; closes ignore the spike of a single candle. Pick one rule and keep it from one chart to the next.
Does the Fibonacci retracement work?
Over five years of Bitcoin on 4-hour candles, price reactions were no more frequent near the levels than next to them, across eight settings. The tool is still useful for describing how deep a pullback is. To decide, you need a stop, a target and a ratio.
What is the difference between Fibonacci retracement and extension?
The retracement measures a pullback inside the move, between 0 and 100% of its height. The extension projects the move beyond its high, to 127.2% or 161.8%, and is often used to set targets. Both rely on the same ratios.
 Mehdi Azizi created TradaZen and published it on the App Store through the Devoria studio. The app's scenarios are real past charts, never made-up data.
TradaZen is a training tool: you play on past market data with a simulated balance. It is not a broker and not investment advice. Real trading carries a risk of capital loss.
