 TradaZen
In 20 seconds
- Definition
- A diagonal line that connects rising lows (uptrend) or falling highs (downtrend).
- Drawing
- Two points make the line, the third confirms it. No close should cross it between the points.
- Break
- A close on the other side of the line. A wick poking through is not enough.
- What the numbers say
- Over five years of Bitcoin on 4-hour candles, neither the third touch nor the break did better than any candle.
- Trap
- Adjusting the line after the fact so it fits the new candles.
A trendline is a straight line drawn by hand on a chart. In an uptrend, it connects higher and higher lows. In a downtrend, lower and lower highs. It is also called a trend line or a diagonal line. It shows the slope of the market at a glance, and it marks the point where your view of the trend becomes wrong.
People often credit it with more: price bouncing off the line, a break announcing a reversal. I measured both ideas on five years of Bitcoin, and neither did better than chance.
This guide describes a training method, not investment advice. Trading carries a high risk of capital loss.
Drawing it: two points, then a third
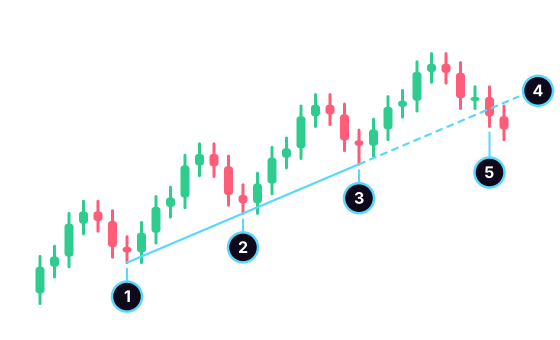
- The first low, at the end of a pullback.
- The second low, higher than the first. These two points are enough to draw the line.
- The third touch: the wick comes back to the line and the close stays above. This is what confirms the line.
- The line extended toward the right side of the chart, where you make your decision.
- The break: the first close below the line.
In a downtrend, everything is reversed. The line connects lower and lower highs, above the candles, and the break is a close above it.
A few rules prevent most bad lines:
- Pick a convention and stick to it. Wicks or candle bodies, but not the wick for one low and the body for the other.
- Two points draw, the third confirms. You can always run a line through two lows. The third touch is the first one you did not choose.
- No close crosses the line between the points. If a candle closes below it between your two lows, your line does not describe the market.
- Lows spaced apart. Two lows three candles apart give a random slope.
- A sustainable slope. A near-vertical line breaks on the first pullback. A nearly flat one becomes a horizontal support.
What it tells you
In an uptrend, each pullback stops higher than the previous one: buyers come back at higher and higher prices. The line connects those stopping points. As long as pullbacks stop above it, the uptrend keeps its regularity.
A close below the line only says that the last pullback went further than the others. Price may then resume on a gentler slope, or move into a range. Two converging diagonal lines form a triangle pattern. Moving averages read the same slope by calculation.
What 5 years of Bitcoin say
I asked two questions. After a third touch that holds, did price follow the trend more often than after any candle? After a break, did it move the other way more often?
| Event | Cases | Expected direction | 6 candles later | 12 candles later |
|---|---|---|---|---|
| touch, uptrend line | 159 | higher | 44% | 47.8% |
| break, uptrend line | 242 | lower | 52.9% | 52.9% |
| touch, downtrend line | 156 | lower | 41.7% | 51.9% |
| break, downtrend line | 239 | higher | 41.8% | 41% |
| any candle | 10,844 | higher | 51.1% | 51.5% |
| any candle | 10,844 | lower | 48.9% | 48.5% |
Method: BTC/USDT, 4-hour candles, public Binance data, from January 1, 2021 to December 31, 2025, or 10,956 candles. Low: a low below the previous 5 candles and not above the next 5, known only 5 candles later, as on a real chart. Uptrend line: two successive lows, the second higher, with no close below the line between them, tracked for ten days at most. Touch: the wick enters a zone of a quarter of the ATR (the average range of a candle) above the line, the close stays above, and the previous candle was outside the zone. Only the first touch counts, the third point. Break: the first close below the line. Downtrend line: the mirror image, on highs. Margin of chance at 95%: 6 to 8 points on the pattern rows, 1 point on the reference rows. Past data: it does not predict the future.
The third touch held no better than chance. On an uptrend line, price was higher six candles later in 44% of cases, versus 51.1% for any candle. The gap even goes the wrong way, without leaving the margin.
The break did not announce what came next either. Below a broken uptrend line, price was lower six candles later in 52.9% of cases, four points above the reference, under the 6-point margin. Lines already confirmed by a third touch did no better: 50.4% over 133 cases. Above a broken downtrend line, price even fell more often than it rose, but that gap disappears when highs are identified over 8 candles.
I reran the measurement with lows identified over 3 and over 8 candles, and with lines tracked for twenty days instead of ten. The number of cases then ranges from 92 to 413, the percentages move by a few points, and no setting produces a favorable gap larger than the margin of chance. That is why I publish these numbers, while I publish none on the head and shoulders: here, the conclusion holds whatever the setting. The line you draw by eye will not be the program's line. It has no reason to predict price any better.
So what is the line for
The line helps you build your plan: it marks the point where your reading of the trend stops being true.
- The stop goes beyond the line, not on it. If you buy near an uptrend line, your idea is wrong when price closes clearly below it. Add a margin for wicks, and remember that the line rises: with each candle, it sits a little higher. The guide on the stop loss puts numbers on what a stop that is too tight costs.
- The target goes before the last high, or before the next resistance. Compare that distance with the stop distance using the risk/reward ratio.
- Size comes next, based on the stop distance, as in the 1% rule.
- A break is not an order. After a close below the line, the question becomes: "where would my bearish idea be wrong?" If there is no clear answer, you stay out.
Common mistakes
- Drawing the line after the fact, picking the points that fit. On the right side of the chart, where you decide, the third touch has not happened yet.
- Redrawing the line with every candle so that it still holds. A line moved after a close below it is a broken line.
- Mistaking a wick for a break. Wicks often cross the line before price moves back. Only the close counts.
- Drawing ten diagonal lines. There will always be one to justify the trade you wanted to take.
Practice drawing before you know
In TradaZen, while you decide, you can draw a trendline or a horizontal line on the chart yourself. What comes next is hidden: you draw without knowing whether the third touch will come. Then you choose Long, Short, or "I stay out". If you enter, the app places the Stop and the Target, and the market reveals what it did, on a Simulated balance.
The "The breakout" unit teaches you to tell a real range breakout from a false start, the same question a broken diagonal line raises. To learn more, read the page on trading exercises.
Frequently asked questions
How do you draw a trendline?
In an uptrend, connect two higher lows, using wicks or bodies, but always the same. Check that no close falls below the line between the two points, then extend it. In a downtrend, connect two lower highs.
How many points does a trendline need?
Two points draw the line, and any two lows will always give you one. The third touch, the first one you did not choose, confirms it. Over five years of Bitcoin, though, it did not announce what came next more often than chance.
What should you do when a trendline breaks?
Nothing automatic. A close below an uptrend line says that the last pullback went further than the others. Over five years of Bitcoin, price then fell in 52.9% of cases, barely more than after any candle.
Should you draw a trendline on wicks or on bodies?
Both are used. Wicks give the price extremes; bodies ignore isolated spikes. Keep the same convention for every point on a line, and judge the break on a close.
What is the difference between a trendline and support?
Support is horizontal: a price where declines have stopped several times. A trendline is sloped: it follows higher and higher lows, and the level to watch rises over time. Both are mainly useful for placing your stop.
 Mehdi Azizi created TradaZen and published it on the App Store through the Devoria studio. The app's scenarios are real past charts, never made-up data.
TradaZen is a training tool: you play on past market data with a simulated balance. It is not a broker and not investment advice. Real trading carries a risk of capital loss.
