 TradaZen

In 20 seconds
- Shape
- At least two highs and two lows, connected by two lines that converge until they cross.
- Ascending
- Highs at the same level, rising lows.
- Descending
- Lows at the same level, falling highs.
- Symmetrical
- Falling highs, rising lows.
- Breakout
- A close beyond one of the two lines. Until then, the triangle has said nothing about what comes next.
A triangle is a market swinging inside a channel that keeps getting narrower. The highs come down, or the lows come up, or both, and price ends up squeezed between two lines that meet. Textbooks turn this into a rule: the ascending triangle breaks up, the descending one breaks down, and the symmetrical one breaks in the direction of the prior trend.
I looked for them across five years of Bitcoin. They are easy to see in hindsight, but their definition depends too much on the settings to produce a reliable number. Here you will see how to draw them, what they tell you, and how to use them without reading more into them than they say.
This guide describes a training method, not investment advice. Trading carries a high risk of capital loss.
The three triangles
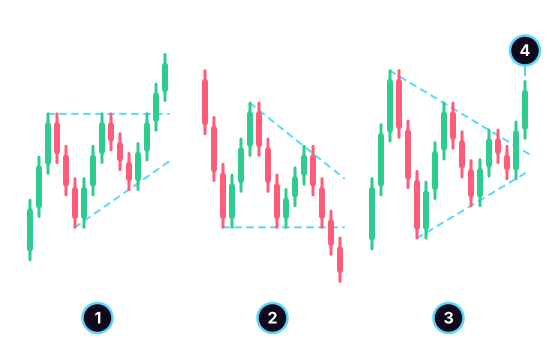
- The ascending triangle: a horizontal line across the highs, a rising line under the lows.
- The descending triangle: a horizontal line under the lows, a falling line across the highs.
- The symmetrical triangle: a falling line across the highs, a rising line under the lows.
- The breakout: the first close beyond one of the two lines.
Each side is a trendline or a horizontal line. Two points are enough to draw a line, and most textbooks ask for at least two touches on each side before calling it a triangle. The point where the two lines cross is called the apex.
Two lines that rise together, or fall together, form a wedge, a different pattern with its own conventions.
What they tell you
In the ascending triangle, sellers hold the same price while buyers come back at higher and higher levels. Resistance stays fixed, support rises. The descending triangle tells the opposite story: buyers defend the same floor, sellers hit lower and lower. The symmetrical triangle shows hesitation tightening, with neither side taking over.
Hence the classic readings: a breakout up for the ascending triangle, down for the descending one, and in the direction of the prior trend for the symmetrical one. These are reading habits. An ascending triangle can perfectly well break down, which is why you wait for the breakout instead of guessing it.
Using them with method
- Wait for two touches on each side before drawing anything.
- Draw the lines on the wicks or on the closes, but always the same one.
- Wait for a close beyond a line. A wick that pokes through and comes back is a false start.
- Place the stop on the other side of the breakout: below the triangle's last low if price exits upward, above its last high if it exits downward.
- Calculate the theoretical target: the height of the triangle at its widest point, projected from the breakout point. It is a calculation convention, not a forecast.
- Check the ratio and the size with the risk/reward ratio and the 1% rule.
Example: an ascending triangle, resistance at 100, first low at 90, last low at 97. Price closes at 101. The height at the widest point is 10, so the theoretical target is 111. With a stop at 96.5, below the last low, you risk 4.5 to aim for 10: a ratio of 1 to 2.2. If price falls back below 96.5, the idea of an upside breakout is wrong, and the loss stays the one you planned.
What 5 years of Bitcoin show
I searched for triangles with a program, on the same data as the other guides: BTC/USDT on 4-hour candles, from 2021 to 2025. The program finds the highs and lows, takes four points in a row, two highs and two lows, and classifies the pattern by the slope of the two lines. It then waits for the first close beyond a line, within 30 candles, before the lines cross.
Two settings weigh on the result: the pullback needed for a high to count (3, 5 or 8%), and the deviation below which a side counts as flat (10 or 20% of the height). I kept two touches on each side. Depending on these choices, I found between 51 and 386 triangles over five years. Split by type and by breakout direction, each group held between 1 and 136 cases, with a margin of chance from 7 to more than 40 points. And the results flipped direction from one setting to another.
A result that depends on the settings proves nothing: you could keep tuning until you got the number you wanted. So I publish no success rate for triangles. The doji and the RSI, which are simpler to define, have their numbers on this site. The head and shoulders and the double top run into the same problem.
Hold the rates you read elsewhere to the same standard. Ask which market, which period, which definition and how many cases.
Common mistakes
- Drawing the triangle after the breakout. On the right edge of the chart, you don't yet know whether the last low really is one.
- Entering before the breakout by betting on its direction, because the triangle is "ascending."
- Moving the lines to keep the triangle alive when price crosses them. A line broken on a close is broken.
- Taking the theoretical target as a promise. Price has no obligation to get there.
- Forgetting the stop on the other side. A breakout can fail, and price can come back into the triangle and then exit through the other side.
Practicing how to judge a breakout
TradaZen does not label triangles. While you decide, you can draw trendlines to set the two sides, or a horizontal line on a flat side. The "The breakout" unit teaches you to tell a real exit from a range apart from a false start, the question every triangle raises as it nears its apex.
You choose Long, Short, or "I stay out." The app places the Stop and the Target, then the market reveals what it did, on a simulated balance. To learn more, read the page on the trading simulator.
Frequently asked questions
What is a triangle in trading?
A pattern where price swings between two converging lines: one connects the highs, the other the lows. Depending on the slope of the two lines, it is called an ascending, descending or symmetrical triangle.
What is the difference between an ascending and a descending triangle?
In the ascending triangle, the highs stay at the same level and the lows rise. In the descending one, the lows stay at the same level and the highs fall. The first is considered bullish, the second bearish, but only the breakout settles it.
Which way does a symmetrical triangle break?
Textbooks say in the direction of the trend that came before it. Nothing forces it to. Wait for the first close beyond one of the two lines, and place your stop on the other side.
How do you calculate a triangle's target?
Measure the height of the triangle at its widest point, between the first high and the first low, then project it from the breakout point. Height of 10, breakout at 101: the theoretical target is 111. It is for calculating a ratio, not for forecasting.
Is the triangle a reliable pattern?
No one can say without a precise definition. Searching for triangles with a program across five years of Bitcoin, I found results that flipped direction depending on the settings, with too few cases per type. Be wary of percentages given without a market, a period or a number of cases.
 Mehdi Azizi created TradaZen and published it on the App Store through the Devoria studio. The app's scenarios are real past charts, never made-up data.
TradaZen is a training tool: you play on past market data with a simulated balance. It is not a broker and not investment advice. Real trading carries a risk of capital loss.
