 TradaZen
In 20 seconds
- Definition
- The Relative Strength Index compares the average gain with the average loss over 14 candles, on a scale from 0 to 100.
- Formula
- RSI = 100 − 100 ÷ (1 + average gain ÷ average loss).
- Zones
- Above 70: overbought. Below 30: oversold. These are reading conventions.
- What it tells you
- The speed of the recent move. A high RSI says the price has risen fast, not that it will fall.
- Trap
- Selling because the RSI is above 70. Over five years of Bitcoin, the price more often kept rising.
The RSI is usually the first indicator people add under a chart. It's a single line running from 0 to 100, plus two thresholds: 70 at the top, 30 at the bottom. The reading taught everywhere is simple. Above 70, the market has risen too far and will pull back. Below 30, it has fallen too far and will bounce.
Over five years of Bitcoin, half of that reading doesn't hold up. The other half barely does.
This guide describes a training method, not investment advice. Trading carries a high risk of capital loss.
What the RSI measures
The RSI, short for Relative Strength Index, was introduced by J. Welles Wilder in 1978. It compares two averages over the last 14 candles: the average gain from one close to the next, and the average loss.
RSI = 100 − 100 ÷ (1 + RS), where RS is the average gain divided by the average loss.
Example: over 14 candles, gains average 2 and losses average 1. RS is 2, and the RSI is 100 − 100 ÷ 3, or 66.7. If the losses disappear, the RSI moves toward 100; if the gains disappear, toward 0. Both averages use Wilder's smoothing: each new candle counts for one fourteenth.
So the RSI measures the speed and consistency of the recent move. It says nothing about when that move ends.
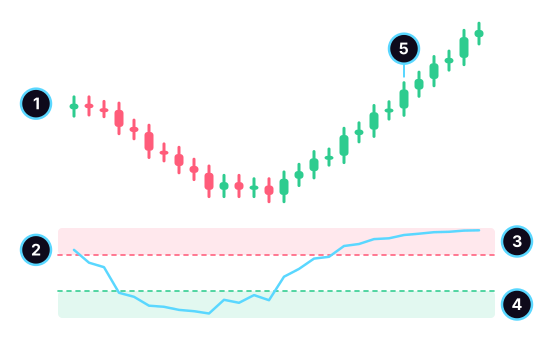
- The price.
- The RSI, drawn under the chart, between 0 and 100.
- The zone above 70, called overbought.
- The zone below 30, called oversold.
- An overbought reading that lasts: the RSI stays above 70 while the price keeps rising.
Settings vary: 14 candles by default, sometimes 9 or 21; thresholds at 70 and 30, sometimes 80 and 20. Keep the same ones from one reading to the next.
What 5 years of Bitcoin show
I counted every time the RSI entered its zones, then looked at the price six and twelve candles later. The classic reading's direction: a higher price after oversold, a lower price after overbought. Each group is compared with its own baseline, taken in the same situation.
| After… | Cases | Classic direction at 6 candles | Classic direction at 12 candles |
|---|---|---|---|
| RSI crosses below 30 | 169 | 61.5% | 58% |
| RSI moves back above 30 | 169 | 56.2% | 49.7% |
| any downtrend candle (baseline, higher price) | 4,468 | 54.1% | 53.1% |
| RSI crosses above 70 | 172 | 45.9% | 49.4% |
| RSI moves back below 70 | 172 | 50% | 48.3% |
| any uptrend candle (baseline, lower price) | 4,760 | 51.9% | 49.5% |
Method: BTC/USDT, 4-hour candles, public Binance data, from January 1, 2021 to December 31, 2025, for a total of 10,956 candles. 14-candle RSI, Wilder smoothing. A case is a threshold crossing, not every candle inside the zone. Downtrend: close below the average of the last 20 closes and below the close 10 candles earlier; uptrend: the opposite. 95% margin of chance: about 7.5 points for the crossings, 1.5 for the baselines. Past data: it does not predict the future.
Oversold gave a slight edge, right at the edge of chance. After a cross below 30, the price was higher six candles later in 61.5% of cases, versus 54.1% for any downtrend candle. The gap, 7.4 points, barely reaches the margin. At twelve candles, it drops to five points, below the margin. Waiting for the RSI to leave the zone, the "confirmation" often recommended, did worse.
Overbought did not signal a decline. After a cross above 70, the price was higher six candles later in 54.1% of cases. Across the 811 candles that closed with an RSI above 70, the price was higher twelve candles later in 58.6% of cases, versus 51.5% for any candle. These candles often come in a row, so the gap is a bit less solid than its 3.4-point margin suggests. Over this period, a high RSI described a strong market more than an exhausted one.
One caveat: Bitcoin nearly tripled between those two dates, from $29,278 to $87,648. A market in a long-term uptrend pushes the numbers in this direction. On another market or another period, the result may change. It's a clue, not a rule.
Reading it methodically
- Read the price first. The RSI is calculated from it: it holds no information the chart doesn't already have.
- Place the RSI within the trend. In a strong uptrend, it can stay above 70 for days. Selling for that reason alone puts you in front of the move.
- Treat oversold as context, not as an entry. A price that has fallen a lot can fall further.
- Decide with a level. Your entry, your stop and your target go on the chart: a low, a high, a support or resistance.
- Calculate the ratio and the size before entering: the risk/reward ratio, then the 1% rule.
Divergence, briefly
A divergence is when the price makes a new low while the RSI makes a shallower low. At the top, it's the reverse. The move continues, but more slowly. Many traders see it as a sign that a reversal is approaching.
I didn't measure it here. Detecting it depends on settings: when a low counts as a low, how many candles between two lows. A result that changes with the settings proves nothing. Remember that a move that slows down is not a move that stops.
Common mistakes
- Selling because the RSI is above 70. Over five years of Bitcoin, the price more often kept rising.
- Buying because the RSI drops below 30, with no stop and no level. The measured edge is thin, and a strong decline keeps the RSI low for a long time.
- Stacking indicators that say the same thing. RSI, stochastic and other oscillators are all derived from the same prices.
- Changing settings until you find the one that "worked" on the past chart.
Practice reading the price
TradaZen doesn't show an RSI. Lessons draw at most two averages or two levels, then remove them: you learn to read the bare price, the size of the candles, their speed, the distance to the last low. That's what the RSI sums up in a single line. For averages, see the guide on moving averages.
In Training, you read a real chart at a real date, with what came next hidden. You choose Long, Short or "I stay out," the app places the stop and the target, then the market reveals what it did, on a simulated balance. To learn more, read the page on trading exercises.
Frequently asked questions
How do you read the RSI?
The RSI runs from 0 to 100. Above 70, the price has risen fast over the last 14 candles; below 30, it has fallen fast. These zones describe a move; they don't say it will reverse. Read it alongside the trend and the levels on the chart.
Which RSI setting should you use?
The original setting, 14 candles, is also the most widely used. A shorter setting makes the RSI more jumpy and pushes it into the zones more often; a longer setting smooths it. The right setting is the one you stick with.
Does an RSI above 70 mean you should sell?
No. Over five years of Bitcoin on 4-hour candles, after the RSI crossed above 70, the price was more often higher than lower six candles later. A high RSI describes a market that is rising fast.
What is an RSI divergence?
The price makes a new high and the RSI a lower high than the previous one, or the price makes a new low and the RSI a higher low. It shows the move is slowing. Slowing down doesn't mean stopping.
 Mehdi Azizi created TradaZen and published it on the App Store through the Devoria studio. The app's scenarios are real past charts, never made-up data.
TradaZen is a training tool: you play on past market data with a simulated balance. It is not a broker and not investment advice. Real trading carries a risk of capital loss.
