 TradaZen
In 20 seconds
- Definition
- The average of the last N closes, recalculated with each new candle. It draws a smoothed line on the chart.
- Calculation
- Simple: the sum of N closes divided by N. Exponential: more weight on the most recent closes.
- What it tells you
- The recent direction of the price, with a lag. The larger N is, the smoother the line and the later it reacts.
- Crossover
- The fast average crosses above or below the slow one. Over five years of Bitcoin on 4-hour candles, it did no better than chance.
- Trap
- Mistaking a description of the past for a forecast.
A moving average predicts nothing. It summarizes. With each candle, it recalculates the average of the most recent closes, and the resulting line shows where the price sits, without the noise of each individual candle.
It is the most widely used indicator, and the simplest to calculate. People attribute a lot to it: "golden" crossovers, supports that follow the price, confirmed trends. I measured what holds up over five years of Bitcoin.
This guide describes a training method, not investment advice. Trading carries a high risk of capital loss.
How to calculate it
The simple moving average adds up the last N closes and divides by N. With five closes of 100, 102, 101, 104 and 103, it equals 510 ÷ 5 = 102. On the next candle, the oldest close drops out, the new one comes in, and you recalculate.
The exponential moving average gives more weight to the most recent closes. With each candle, it moves by a fraction of the gap between the new close and its previous value. That fraction is 2 ÷ (N + 1), a little under one tenth for a 20-candle average. It reacts faster than the simple one, and it also follows more of the noise.
They are often written MA20 or MA50, and EMA for the exponential one. The most watched settings are 20, 50, 100 and 200 candles. None is better than the others: the right setting is the one you keep from one chart to the next.
How to read it
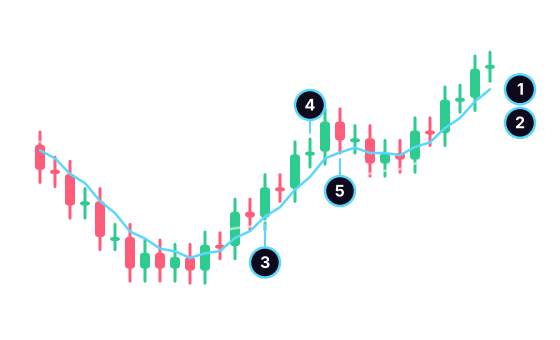
- The fast average, over few candles: it hugs the price.
- The slow average, over more candles: it smooths more and reacts later.
- The crossover: the fast one crosses above the slow one.
- The price above both averages: this is called an uptrend.
- The pullback: the price comes back to touch the fast average.
Textbooks offer three readings. First, the price's position: above its averages, it has been rising for a while; below them, it has been falling; in between, it is hesitating. Second, the crossover: the fast one crossing above the slow one is a bullish crossover, called a "golden cross" for the 50 and 200 averages on the daily chart, and a "death cross" in the other direction. Third, the slope: a rising average describes a rise, a flat average a market with no direction.
What 5 years of Bitcoin show
I took the two exponential averages TradaZen draws, over 20 and 50 candles. After each crossover, each price position and each pullback, did the price move in the expected direction six and twelve candles later? Expected direction: higher after a bullish case, lower after a bearish case.
| After… | Cases | Expected direction at 6 candles | Expected direction at 12 candles |
|---|---|---|---|
| bullish crossover (20 above 50) | 102 | 45.1% | 55.9% |
| bearish crossover | 103 | 44.7% | 49.5% |
| price above both averages | 4,840 | 49.3% | 50.9% |
| price below both averages | 4,575 | 45.8% | 46.6% |
| pullback to the 20 average, uptrend | 272 | 53.7% | 54% |
| pullback to the 20 average, downtrend | 247 | 49.4% | 46.2% |
| any candle, price higher (baseline) | 10,844 | 51.1% | 51.5% |
| any candle, price lower (baseline) | 10,844 | 48.9% | 48.5% |
Method: BTC/USDT, 4-hour candles, public data from a cryptocurrency exchange, from January 1, 2021 to December 31, 2025. Exponential averages over 20 and 50 closes, calculated as in the app. Uptrend pullback: the 20 average is above the 50, the price closes above the 50, the wick touches the 20 average and the close ends above it; the previous candle did not touch it. Downtrend pullback: the mirror image. Each candle above or below both averages counts as one case. Margin of chance at 95%: about 10 points for crossovers, 6 for pullbacks, 1.5 for price positions, 1 for the baselines. Past data: it does not predict the future.
The averages did not call what came next. Crossovers are on par with a random candle, within the margin, and their gap flips sign between six and twelve candles. The uptrend pullback to the 20 average does two to three points better than the baseline, well under the margin. A close breaking the 50 average did no better: 47.1% in the expected direction at six candles on the upside, 46.6% on the downside, over 410 cases each.
One result even runs against conventional wisdom. When the price closed below both of its averages, it was higher six candles later in 54.2% of cases, more often than after a random candle. These candles come in runs and look alike, so the gap is a bit less certain than its margin suggests. Over this period, staying below its averages did not signal further downside.
The explanation lies in the calculation. An average is made of past prices: by the time it crosses, the move it summarizes has already happened.
Golden crosses on the 50 and 200 simple averages on the daily chart are too rare to count: five in five years, and six death crosses. No percentage on so few cases would mean anything. It is a clue, not a rule.
What an average does well
It tells you what setting you are walking into. Buying a market that has stayed below its averages for weeks means buying against the recent move. Nothing forbids it, as long as you know it. It also shows you when the price has moved far from its average. The move is then well advanced, and your stop, if it has to go below the last low, will be far away.
For the rest, the decision is yours: a level where your idea is proven wrong, a target, a risk/reward ratio worth taking, a size calculated from the stop.
Reading it with method
- Choose your settings once and keep them. Switching averages until you find one that "works" on the past chart is fitting the past.
- Name the situation: price above both averages, below them, or in between.
- Look for a level where your idea is proven wrong: a low, a high, a support or resistance.
- Place your stop beyond that level, not beyond the average, which moves with every candle.
- Check the ratio and the size, with the 1% rule.
- Write the decision in your trading journal, with the situation named.
Common mistakes
- Buying a crossover without checking where the logical stop sits. When the averages cross, the price has often already risen a lot.
- Stacking averages. Four or five lines end up contradicting each other, and one of them always proves you right.
- Treating the average as a wall. The price crosses it constantly, especially when the market has no direction.
- Forgetting the lag. On the daily chart, a 200-candle average reacts weeks late.
Practice reading moving averages
In TradaZen, the "Follow the trend" unit draws the 20 and 50 averages on real charts. In the first two lessons, the app names them and gives the reading: "Price above both averages: the trend is up. Below: it is down." In the third, it leaves only the lines. In the fourth, nothing at all. The "Pullback" unit does the same with the return to the 20 average.
There, the averages help you name the situation, then fade away. The question remains: "Where is the market going?" You choose Long, Short, or "I stay out", the app sets the stop and the target, and the market reveals what happened next, on a simulated balance. To learn more, read the page on the trading simulator.
Frequently asked questions
Which moving average should you use in trading?
The most watched cover 20, 50, 100 and 200 candles. None is better in itself: a short average follows the price closely, a long one describes the underlying move. Pick one or two and keep them, so your readings stay comparable.
What is the difference between a simple and an exponential moving average?
The simple one gives the same weight to every close in the period. The exponential one weighs the most recent ones more: it reacts faster to changes, and also follows more of the noise. At the same setting, the gap between the two stays small.
What does a moving average crossover mean?
The fast average crosses above the slow one (bullish crossover) or below it (bearish crossover). It says the latest prices are higher, or lower, than the older ones. Over five years of Bitcoin on 4-hour candles, with the 20 and 50 averages, the price did not move in the crossover's direction more often than chance.
What is a golden cross?
The 50 average crossing above the 200 average on the daily chart; the reverse is called a death cross. On Bitcoin, from 2021 to 2025, there were five golden crosses and six death crosses. That is too few to measure anything.
Can a moving average predict the price?
No. It is made of past prices and lags by construction. It helps describe the situation, not guess the next candle.
 Mehdi Azizi created TradaZen and published it on the App Store through the Devoria studio. The app's scenarios are real past charts, never made-up data.
TradaZen is a training tool: you play on past market data with a simulated balance. It is not a broker and not investment advice. Real trading carries a risk of capital loss.
