 TradaZen
In 20 seconds
- Definition
- A simple moving average over 20 candles, surrounded by two bands set two standard deviations above and below it.
- What they tell you
- How widely the price has been spreading lately. Wide bands mean the price is moving a lot; tight bands mean it is moving little. They say nothing about direction.
- Band breakout
- A close outside the bands. Over five years of Bitcoin, it was not followed by a return to the average more often than chance.
- Squeeze
- The bands move closer together when the market calms down. They then widened, without the price moving more than usual.
- Trap
- Buying every close below the lower band while waiting for a bounce.
Bollinger Bands draw a channel around the price. It widens when the market gets choppy and narrows when it calms down. Two readings are common: a price that leaves the channel will come back into it, and a narrow channel signals a big move.
I tested both on five years of Bitcoin. The first does not hold up. The second holds up halfway: after a squeeze, the bands do widen, but the price moves no more than usual.
This guide describes a training method, not investment advice. Trading carries a high risk of capital loss.
How the bands are calculated
John Bollinger introduced them in the early 1980s. They are made of three lines, recalculated on every candle.
- The middle band: the simple moving average of the last 20 closes.
- The upper band: the middle band plus two standard deviations of those 20 closes.
- The lower band: the middle band minus two standard deviations.
The standard deviation measures how spread out the closes are around their average. Twenty closes ranging from 99 to 101 have a standard deviation of about 0.6, so the bands sit 1.2 above and below the average. Twenty closes ranging from 90 to 110 give bands ten times wider. The width follows how much the price is moving, not where it is heading.
You will often read that 95% of closes stay inside the bands. That figure comes from the normal distribution, and prices don't follow it. Over five years of Bitcoin on the 4-hour chart, 13.5% of closes ended outside the bands, nearly three times the assumed 5%.
Reading them
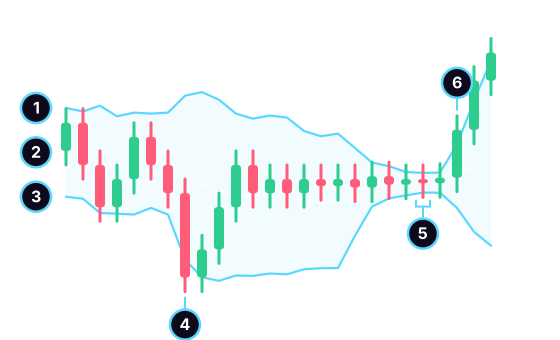
- The upper band.
- The middle band.
- The lower band.
- A close below the lower band, after a sharp drop.
- The squeeze: the price calms down and the bands move closer together.
- The breakout: a close above the upper band as the squeeze ends.
Three readings keep coming up. In the first, a move outside a band is an excess: below the lower band, the price would be "too low" and should return to the middle. In the second, it is a sign of strength: a price riding the upper band is rising steadily. Bollinger himself pointed out that touching a band is not a signal. The third watches for the squeeze, which is supposed to end in a sharp move, with the first close outside the channel showing its direction.
What 5 years of Bitcoin show
I put each of these readings to the test by looking at the price six and twelve candles later. For a move outside a band, the expected direction is a return toward the average.
| Below the lower band | Cases | Higher 6 candles later | Higher 12 candles later |
|---|---|---|---|
| close below the band | 330 | 54.5% | 52.7% |
| down candle (baseline) | 4,468 | 54.1% | 53.1% |
| Above the upper band | Cases | Lower 6 candles later | Lower 12 candles later |
|---|---|---|---|
| close above the band | 327 | 45.6% | 47.1% |
| up candle (baseline) | 4,760 | 51.9% | 49.5% |
For the squeeze, two questions: did the bands widen, and did the price make a big move?
| After a squeeze | Cases | 6 candles later | 12 candles later |
|---|---|---|---|
| wider bands | 88 | 63.6% | 85.2% |
| baseline: all candles | 10,844 | 48% | 48.2% |
| big move | 88 | 50% | 45.5% |
| baseline: all candles | 10,844 | 50% | 50% |
Method: BTC/USDT, 4-hour candles, public Binance data, from January 1, 2021 to December 31, 2025, for a total of 10,956 candles. Bands on 20 closes and two standard deviations. A breakout case is the first close outside the band, with the previous close inside it. Down: a close below the average of the last 20 closes and below the close 10 candles earlier; up: the opposite. Squeeze: the band width is the lowest of the last 120 candles (20 days), with at least 12 candles between two cases. Big move: a close-to-close change, in either direction, larger than the median of all candles (1.38% over six candles, 2.06% over twelve). Margin of chance at 95%: about 5.5 points for band breakouts, 7 to 10 for squeezes, 1.5 for the baselines. Past data: it says nothing certain about the future.
Closing below the band did not signal a bounce. After a close below the lower band, the price was higher six candles later in 54.5% of cases, versus 54.1% for any down candle. The gap is less than half a point.
Closing above the band tended to come before further gains. After a close above the upper band, the price was higher six candles later in 54.4% of cases, versus 48.1% for any up candle. The gap, 6.3 points, barely exceeds the margin, and it shrinks to 2.4 points at twelve candles. Over this period, a price breaking out above the band was more often a strong price than an exhausted one.
The squeeze kept half its promise. Twelve candles later, the bands had widened in 85.2% of cases, versus 48.2% for any candle: unusual calm does not last. The price, however, moved no more than usual, with 45.5% big moves at twelve candles against 50% expected. With a squeeze defined over 10 days instead of 20, or 155 cases, the finding is the same: 76.8% wider bands, 52.3% big moves.
The breakout that follows a squeeze remains out of reach: 36 upside breakouts and 48 downside ones in five years. The margin exceeds 14 points, too much to draw a conclusion. One caveat for all these figures: Bitcoin nearly tripled over the period, which pushes them upward. This is a clue, not a rule.
Using them with method
The bands show how choppy the market is at a glance, and your plan depends on it. When they are tight, a stop below the last low stays close. When they are wide, the same stop is far away, and your position has to be smaller for the same risk.
- Name the situation: a price riding a band, swinging around the middle, or going sideways inside tight bands.
- Don't trade the return to the average on principle. Over five years of Bitcoin, it was no more frequent than chance.
- Place your stop beyond a price level: a low, a high, a support or resistance. A band moves with every candle and makes a poor reference.
- Size your position from that stop, with the 1% rule, then check the risk/reward ratio.
Common mistakes
- Buying every close below the lower band. Over five years of Bitcoin, a bounce was no more frequent than after any down candle.
- Selling because the price touches the upper band. A price riding the upper band is rising, often for a while already.
- Expecting a big move from a squeeze. The bands widen afterward, but the price moved no more than usual.
- Stacking the bands, the RSI and the MACD. They are all calculated from the same closes.
Practicing reading a channel
TradaZen does not display Bollinger Bands. The "Range" unit works on the same question using the bare price: a market moving back and forth between two boundaries. The app draws the support and resistance in the first lessons, then removes them. The "Breakout" unit teaches you to tell a real exit from a range from a false start, the same question a squeeze ending raises.
While you decide, you can draw a horizontal line or a rectangle. You choose Long, Short, or "I stay out", the app sets the stop and the target, then the market reveals what happened next, on a simulated balance. To learn more, read the page on the trading simulator.
Frequently asked questions
How do you read Bollinger Bands?
First look at their width: wide means the price is choppy, tight means it is calm. Then look at where the price sits: near a band or in the middle. These readings describe the recent movement, not what comes next.
What settings should you use for Bollinger Bands?
The original setting, 20 candles and two standard deviations, is still the most widely used. You will also see 10 candles and 1.5 standard deviations, or 50 and 2.5. A short setting makes the bands jumpy, a long one smooths them out: keep the same one from one reading to the next.
What should you do when the price closes below the lower band?
Nothing in particular. Over five years of Bitcoin, the price did not bounce more often after a close below the lower band than after any down candle. Decide with a level, a stop and a ratio.
What is a Bollinger Band squeeze?
A moment when the bands are closer together than they have been for a long time, because the price is barely moving. Over five years of Bitcoin, the bands widened afterward in more than eight cases out of ten, but the price made no bigger moves than usual.
 Mehdi Azizi created TradaZen and published it on the App Store through the Devoria studio. The app's scenarios are real past charts, never made-up data.
TradaZen is a training tool: you play on past market data with a simulated balance. It is not a broker and not investment advice. Real trading carries a risk of capital loss.
