 TradaZen

In 20 seconds
- Definition
- The Moving Average Convergence Divergence measures the gap between the exponential moving average of the last 12 closes and that of the last 26.
- Calculation
- MACD = 12-period average − 26-period average. Signal = 9-candle average of the MACD. Histogram = MACD − signal.
- What it tells you
- The speed of the recent move, with a lag: it is built from averages, so from past prices.
- Crossover
- The MACD moves above or below its signal line. Over five years of Bitcoin on the 4-hour chart, it did no better than chance.
- Trap
- Buying every bullish crossover as a signal, with no level and no stop.
The MACD is the indicator you find under almost every chart, right next to the RSI. It comes down to two lines and a histogram, and the rule people draw from it looks simple: buy when the MACD line crosses above its signal line, sell when it crosses below.
I counted these crossovers over five years of Bitcoin, and they did not call what came next. The MACD still has a use, describing the move in progress, as long as you know what it is made of.
This guide describes a training method, not investment advice. Trading carries a high risk of capital loss.
How the MACD is calculated
The MACD, short for Moving Average Convergence Divergence, was designed by Gerald Appel in the late 1970s. It is calculated in three steps, from closing prices.
- The MACD line: the exponential moving average of the last 12 closes, minus that of the last 26.
- The signal line: the exponential moving average of the last 9 MACD values.
- The histogram: the MACD line minus the signal line, drawn as bars around zero.
Example: the 12-period average is 105 and the 26-period average is 100. The MACD is 5, because recent prices are higher than older ones. If the signal is 4, the histogram is 1 and the MACD is above its signal.
The MACD is expressed in price units. A gap of 5 does not carry the same weight on a $100 stock and on Bitcoin at $80,000. Compare it with itself, on the same chart, never from one market to another.
An exponential average gives more weight to the latest closes; the guide on moving averages walks through the calculation. The MACD inherits their flaw: it arrives late. The signal line, an average of a difference of averages, adds yet another layer of lag.
Reading it
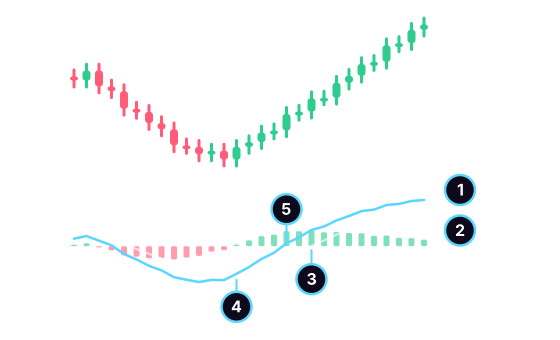
- The MACD line: the gap between the short and the long exponential average.
- The signal line: the smoothed MACD.
- The histogram: the gap between the two lines, as bars on either side of zero.
- The bullish crossover: the MACD moves above its signal, near the price low.
- The zero-line cross: the MACD turns positive, the short average moves above the long one.
Two events come up again and again in textbooks. First, the signal crossover: when the MACD moves above it, it is called a bullish crossover, and the histogram turns from red to green. Some traders only keep bullish crossovers that happen below zero, supposed to catch the reversal earlier. Second, the zero-line cross: it says the 12-period average has just moved above the 26. It is a moving average crossover, presented differently.
The histogram adds nothing the two lines do not already contain. When its bars shrink, the gap between the MACD and its signal narrows and the move slows down. The crossover comes when they reach zero.
What 5 years of Bitcoin show
I marked every crossover and every zero-line cross, then looked at the price six and twelve candles later. Expected direction: higher after a bullish case, lower after a bearish one.
| After… | Cases | Expected direction at 6 candles | Expected direction at 12 candles |
|---|---|---|---|
| bullish crossover | 426 | 50% | 50.5% |
| bullish, below zero | 268 | 50.4% | 52.6% |
| cross above zero | 192 | 45.3% | 44.3% |
| bearish crossover | 426 | 43.7% | 46.7% |
| bearish, above zero | 275 | 41.8% | 48.4% |
| cross below zero | 192 | 51% | 50.5% |
| baseline: higher price | 10,844 | 51.1% | 51.5% |
| baseline: lower price | 10,844 | 48.9% | 48.5% |
Method: BTC/USDT, 4-hour candles, public data from Binance, from January 1, 2021 to December 31, 2025, or 10,956 candles. MACD on 12 and 26 closes, signal on 9, exponential averages seeded with a simple average. A case is the crossover candle. Baseline: any candle. Margin of chance at 95%: about 5 points for crossovers, 6 for their below-zero and above-zero variants, 7 for zero-line crosses, 1 for the baselines. Past data: it says nothing certain about the future.
The bullish crossover was even with chance. After the MACD crossed above its signal, the price was higher six candles later half the time, against 51.1% for any candle. The below-zero crossover, said to be earlier, does no better: less than one point of difference at six candles, barely more than one at twelve.
The bearish crossover tended to come before a rise. Six candles later, the price was higher in 56.3% of cases, against 51.1% for any candle. The gap, 5.2 points, only just exceeds the margin, and it falls under 2 points at twelve candles. Above zero, it reaches 7.1 points at six candles, then vanishes at twelve. Out of twelve comparisons, seeing two cross the margin can happen by chance: I draw no rule from it.
The zero-line cross did not call anything either. Upward, the price moved in the expected direction in 45.3% of cases at six candles, less often than any candle, but within the margin.
The explanation lies in the calculation, as with moving averages: when two averages cross, the move they summarize has already happened. Bitcoin also nearly tripled between those two dates, from $29,278 to $87,648, and an underlying uptrend pushes the figures upward. On another market or another period, the result may change.
Reading it with a method
- Read the price first. The MACD is calculated from closes: it sees nothing the chart does not show.
- Name the situation. MACD above zero: the short average is above the long one, the price has been rising for a while. Below, it has been falling.
- Read the histogram as a speed. Shrinking bars say the move is slowing. Slowing does not mean stopping.
- Decide with a level. Your stop goes behind a low, a high, a support or resistance, not behind a line that moves with every candle.
- Work out the ratio and the size before entering: the risk/reward ratio, then the 1% rule.
Divergence calls for the same caution. A divergence is when the price makes a new high and the MACD makes a lower one, or the reverse at the bottom. I did not measure it: detecting it depends on settings, and a result that changes with the settings proves nothing. At best, it says the move is losing speed.
Common mistakes
- Buying every bullish crossover. Over five years of Bitcoin, it did no better than any candle.
- Reading the MACD as a bounded oscillator. It has no ceiling and no floor, and its value depends on the asset's price. A "very high" MACD can only be compared with its own past values.
- Taking the MACD, the RSI and the averages as three opinions. They all come from the same closes.
- Changing settings, 8, 17 and 9 or 5, 35 and 5, until you find the one that "worked" on the past chart.
- Forgetting the lag. On a daily chart, the crossover can come days after the low.
Practice reading the move
TradaZen does not show a MACD. The "Follow the trend" unit draws the 20 and 50 averages on real charts, names them in the first two lessons, then removes them. The MACD is made of the same material, with two extra layers of calculation: learning to read two averages and the bare price already gives you what it summarizes.
In Training, you read a real chart at a real date, with what came next hidden. You choose Long, Short, or "I stay out", the app sets the Stop and the Target, then the market reveals what it did, on a simulated balance. To learn more, read the page on trading exercises.
Frequently asked questions
How do you read the MACD?
Look at where the MACD line sits relative to its signal, then relative to zero. Above zero, the 12-period average is above the 26: the price has been rising for a while. Above the signal, the recent move is speeding up to the upside. These readings describe the recent past.
What settings should you use for the MACD?
The original setting, 12, 26 and 9, is still the most widely used. Shorter settings make the lines jumpier and produce more crossovers. None predicts better than the others: stick with the one you chose, so your readings stay comparable.
Is a MACD crossover a buy signal?
No. Over five years of Bitcoin on 4-hour candles, after a bullish crossover, the price was higher six candles later half the time, just as after any candle. The crossover says the recent move has changed speed.
What is the difference between the MACD and the RSI?
The RSI compares recent gains and losses on a scale from 0 to 100. The MACD measures the gap between two averages, in price units, with no limit. Both come from the same closes and describe the speed of the recent move.
 Mehdi Azizi created TradaZen and published it on the App Store through the Devoria studio. The app's scenarios are real past charts, never made-up data.
TradaZen is a training tool: you play on past market data with a simulated balance. It is not a broker and not investment advice. Real trading carries a risk of capital loss.
