 TradaZen
In 20 seconds
- The axes
- Price on the vertical, often on the right; time on the horizontal, from oldest to most recent.
- The timeframe
- How long one candle lasts: one minute, four hours, one day. Over five years of Bitcoin, more than one 4-hour candle in three went against its day.
- The trend
- Highs and lows that rise, or that fall. Otherwise, the market moves back and forth in a range.
- Levels
- Prices where the market has already reacted: former highs, former lows.
- The scale
- On a linear scale, every dollar has the same height; on a logarithmic scale, every percentage does.
A stock chart shows how a price changes over time. Reading one means answering a few simple questions in order: over what period, in which direction, around which prices, on what scale. Patterns and indicators come later.
People often start at the end: looking for a signal before knowing what the screen shows. Here I go back over the basics in the order I read them.
This guide describes a training method, not investment advice. Trading carries a high risk of capital loss.
What a chart shows
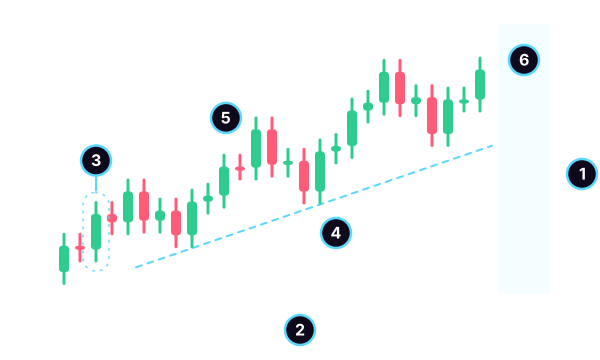
- The price axis, on the right on most platforms. Higher means more expensive.
- The time axis, at the bottom: the past on the left, the most recent on the right.
- A candle: one period, circled here. Its height matters; its width tells you nothing.
- The trend: higher and higher lows. The dotted line connects them.
- A level: a former high. Price broke above it, then came back to touch it from above.
- The right side: after the last closed candle, empty space. That is where you decide, without seeing what comes next.
Above all, remember marker 6. On a finished chart, everything looks obvious, because you see what came next. When you have to decide, all you have is what lies to the left of the empty space.
Below the chart, many platforms add volume: one bar per period, taller when many shares or tokens changed hands. It tells you how much the market traded, not which way it is heading.
Line, bars or candles
The same prices can be drawn in three ways.
| Type | What it shows | What it hides |
|---|---|---|
| Line | the sequence of closes | the extremes and the open |
| Bars | all four prices | nothing, but slower to read |
| Candles | all four prices, in color | nothing |
The line connects the closes: it gives you the direction at a glance, but it erases the wicks. Bars show a vertical stroke from low to high, with a small tick on the left for the open and one on the right for the close. Candles show the same four prices, with a colored body between the open and the close. The guide on candlesticks explains how to read one in detail.
The timeframe changes the story
The timeframe is the length of time each candle summarizes. On a one-minute chart, price zigzags constantly. On a daily chart, the same market can rise steadily for weeks. Neither reading is wrong: they are not talking about the same thing.
So before reading a candle, ask yourself which larger candle it sits inside. If you read the 4-hour chart, look at the daily chart first.
What 5 years of Bitcoin show
I wanted to measure how much the timeframe changes the reading. Over five years of Bitcoin, I compared each 4-hour candle with the day it belongs to, then each day with its week. The question: do they move in the same direction?
| Comparison | Cases | Same direction |
|---|---|---|
| 4h candle and its day | 10,956 | 61.5% |
| day and its week | 1,820 | 59.1% |
| 4h candle and its week | 10,920 | 53.4% |
| pure chance (baseline) | theoretical | 50% |
Method: BTC/USDT, 4-hour candles, public Binance data, from January 1, 2021 to December 31, 2025, that is 10,956 candles, 1,826 days and 260 complete weeks. Day: midnight to midnight UTC, six 4-hour candles. Week: Monday to Sunday. Same direction: both periods close above their open, or both below. 95% margin for chance: 0.9 points for 4-hour candles, 2.3 points for days. Past data: it does not predict the future.
More than one 4-hour candle in three went against its own day. A green 4-hour candle can very well belong to a red day. Depending on the time slot, the share ranges from 58.3% to 65.2%: the time of day does not change the finding.
Against the week, the 4-hour candle does barely better than a coin toss: 53.4%. And days when all six 4-hour candles share the same color are rare, 1.8% of days.
The same candle can tell a story of rising prices on the 4-hour chart and belong to a decline on the weekly. You only see the second story by looking at the timeframe above.
Linear or logarithmic
The scale of the price axis also changes what you see. Over the same period, Bitcoin's lowest 4-hour close was $15,723, on November 21, 2022. The highest was $125,411, on October 6, 2025: almost eight times higher.
A $1,000 move represented 6.4% of the price at the low, and 0.8% at the high. On a linear scale, these two moves have the same height on screen, even though the first weighs nearly eight times more. On a logarithmic scale, the same percentage has the same height: a 10% rise takes up as much space in 2022 as in 2025.
Over a few days, the difference is invisible. Over several years, or on an asset that has risen a lot, switch to logarithmic. Otherwise, older moves look flattened and recent ones look huge.
Reading a chart in six steps
- Choose your timeframe, then look at the one above it.
- Find the trend. Highs and lows that rise, that fall, or a range between two boundaries. A trendline connects the lows of an uptrend or the highs of a downtrend.
- Draw two or three levels, no more: the clearest former highs and lows. The support and resistance guide shows how.
- Read the latest candles, on the right side: their size, their wicks, their speed.
- Look for where your idea becomes wrong. That is where your stop loss goes, and that is what your risk/reward ratio is calculated from.
- Write your reading in your journal, even when you stay out.
Indicators come next, if they help. Moving averages, the RSI, the MACD and Bollinger Bands are all calculated from the same prices you already see.
Common mistakes
- Judging a pattern on the left side. Patterns drawn after the fact always look clean. The one that matters is on the right, unfinished.
- Switching timeframes until you find one that confirms your idea. Choose it before you look.
- Forgetting the price axis. A platform often fits the scale to what is displayed: a huge candle on screen can be a tiny move.
- Comparing years on a linear scale. Older moves look flat.
- Stacking indicators until you can no longer see the price.
Practice on real charts
In TradaZen, each scenario is a real past chart, on a timeframe from 4 hours to 1 minute, with what came next hidden. The path of lessons goes from candles to decisions: Nova, the app's astronaut, explains the charts with zooms and annotations.
While deciding, you can draw a horizontal line, a trendline or a rectangle. You choose Long, Short or "I stay out", the app sets the stop and the target, then the candles appear one by one. At the end, you see the real date, the real time and the source of the scenario, on a simulated balance. To see how it all works, read the page on the trading simulator.
Frequently asked questions
How do you read a stock chart as a beginner?
Start with the axes: price on the vertical, time on the horizontal. Identify the timeframe, then the trend, then two or three levels where price has already reacted. Finally, read the latest candles, on the right side. Indicators only come after that.
Which timeframe should you choose?
The one that matches the length of your decisions, always with a glance at the timeframe above. Over five years of Bitcoin, more than one 4-hour candle in three went against its day: without the higher timeframe, you only see part of the story.
Should you use a linear or logarithmic scale?
Over a few days, it doesn't matter. Over several years, use logarithmic: it gives the same height to the same percentage. Over five years of Bitcoin, $1,000 represented 6.4% of the price at the low and 0.8% at the high.
What does the volume below the chart represent?
Volume counts what was traded during each period. A tall bar says that many shares or tokens changed hands. It does not say which way the price will go next.
Can a chart predict the price?
No. A chart summarizes what happened. It helps you decide where to enter, where to exit and where your idea becomes wrong, but the right side remains unknown. The patterns measured over five years of Bitcoin in these guides did not clearly beat chance.
 Mehdi Azizi created TradaZen and published it on the App Store through the Devoria studio. The app's scenarios are real past charts, never made-up data.
TradaZen is a training tool: you play on past market data with a simulated balance. It is not a broker and not investment advice. Real trading carries a risk of capital loss.
