TradaZen

In 20 seconds
- Definition
- The price at which you exit a losing trade, decided before you enter. It sets your risk: 1 R.
- Where
- Where your idea becomes wrong: below the last swing low on a buy, above the last swing high on a sell, beyond a level.
- Example
- Buy at 100, last swing low at 97, average candle range of 2: stop around 96, below the low with half a candle of room.
- Trap
- Tightening it to make the ratio look better. Over five years of Bitcoin, a stop half a candle away was hit in 72% of cases within 24 hours, on entries with no reading at all.
The stop loss is the part of the trade you fully control. You don't choose where the price goes, but you do choose where you get out if you're wrong. It sets what the trade can cost you: your "1 R."
Where to put it has a simple answer. The stop goes where your idea becomes wrong. Two traps make it harder: placing it too close, inside the ordinary noise of price, or choosing it based on position size instead of the chart.
This guide describes a training method, not investment advice. Trading carries a high risk of capital loss.
Place it where your idea becomes wrong
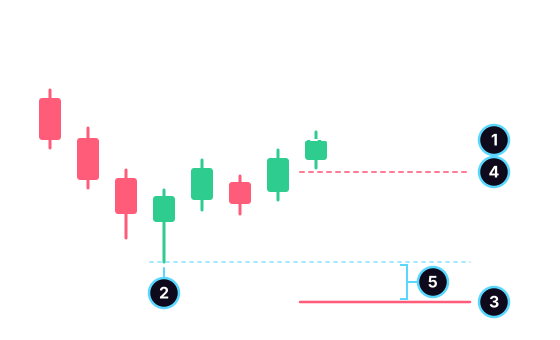
- The entry.
- The last swing low: if it breaks, the buy idea is wrong.
- The stop, below the swing low.
- The stop that is too tight: it sits in the ordinary noise of the candles.
- The room between the swing low and the stop, a fraction of the average range of one candle.
Every trade rests on an idea: "price holds above this low," "resistance has given way," "the uptrend continues." The stop goes at the exact point where that idea no longer holds.
- On a buy, below the last swing low, or below a support.
- On a sell, above the last swing high, or above a resistance.
- After a pattern, beyond its extreme: below the wick of a hammer, above the right shoulder of a head and shoulders.
- With some room. Wicks often poke a few points past a level before turning back. Traders usually add a fraction of the average range of one candle.
That average range has a name: the ATR, for Average True Range. It is the average range of the last 14 candles, price gaps included. On Bitcoin with 4-hour candles, its median was 1.54% of price between 2021 and 2025. It lets you say "tight" or "wide" whatever the market.
What a stop that is too tight costs you
I measured the noise over five years of Bitcoin. For each candle, I imagined a buy at its close, with no reading at all, and a stop at a fixed distance below. Then I counted how often a wick touched it within the next 6 candles (24 hours) and the next 12 (48 hours).
| Stop distance | Hit within 24 hours | Hit within 48 hours |
|---|---|---|
| 0.5 ATR | 72.3% | 81.3% |
| 1 ATR | 48% | 62.4% |
| 1.5 ATR | 32.4% | 47.3% |
| 2 ATR | 22.1% | 35.8% |
| 3 ATR | 10.6% | 20.6% |
| below the lowest low of the last 10 candles | 36.1% | 47.8% |
Method: BTC/USDT, 4-hour candles, public Binance data, from January 1, 2021 to December 31, 2025, for 10,844 entries. ATR: average of the true ranges of the last 14 candles, calculated as in the app. The stop below the lowest low of the last 10 candles sat at a median of 1.47 ATR from the entry. On a sell, with a stop above, the figures are almost identical. 95% margin of error: less than one point. Past data: it says nothing certain about the future.
These entries involve no reading: they measure what the market does at random. A stop half a candle away gets hit nearly three times out of four within 24 hours, whether your idea is good or not. At 1 ATR, one time in two. Noise does not judge your analysis.
The stop below the last swing low behaves roughly like a stop at 1.5 ATR, its median distance. It protects no better than any other stop at the same distance. Its only advantage is that it sits where the idea becomes wrong: when it gets hit, you know why.
Wide or tight: position size makes the difference
A wider stop gets hit less often. That doesn't make it safer, because it costs more when it is hit. For the risk to stay the same, the position has to shrink.
Example: a €10,000 account, 1% risk, so €100. Stop 1% below the entry: a €10,000 position. Stop at 3%: a €3,333 position. If the stop is hit, the loss is €100 in both cases. The full calculation is in the guide on the 1% rule.
The other consequence concerns the target. A stop twice as far away needs a target twice as far away to keep the same risk/reward ratio. If the chart doesn't offer that room, the trade isn't worth its risk. You sit it out, you don't tighten the stop.
A stop order does not guarantee the price
With an intermediary, a stop loss takes the form of a triggered order. The Autorité des marchés financiers (AMF), the French market regulator, describes two kinds on its page about stock market orders:
- The stop order with a trigger threshold becomes a market order as soon as the threshold is reached. It gets executed, but you don't control the price.
- The stop order with a trigger range becomes a limit order. You control the price, but it may not be executed, or only partly.
The AMF ombudsman reports the case of an investor whose stop sell orders, set at €12.03 and €11.98, were executed at €11.42, after an opening equilibrium price, the fixing, of €11.34. The case file is a reminder: in high volatility, the order can fill well below the threshold. Your actual loss can therefore exceed the planned R.
The method, step by step
- Write down your idea in one sentence, before entering.
- Find the price that makes it wrong: a swing low, a swing high, a level.
- Add some room for wicks, a fraction of the ATR.
- Spot a target on the chart and calculate the ratio. If it's too low, no trade.
- Calculate the size from the stop distance.
- Never move it further away. You can move it closer to reduce risk, never further away in hope.
- Record in your trading journal whether the stop was hit by noise or by a real invalidation.
Common mistakes
- Tightening it to make the ratio look better. The ratio improves on paper, and the stop gets hit in reality.
- Choosing it from the size: a round size first, then a stop "wherever it fits." The stop should depend on the market, not on your account.
- Moving it away as price gets close. The loss exceeds the planned R and no longer has a limit. It is one of the signs of tilt.
- Keeping it in your head. A mental stop gets negotiated at the exact moment it should be executed.
- Placing it right on the swing low or the level. Wicks cut through before turning back, and the stop gets hit by a few points.
Practice placing your stop
In TradaZen, the "Position size" unit asks you what happens when you take a round size and then place the stop wherever it fits. The app's answer: you "set the stop based on the account instead of the market." The "The plan and the journal" unit reminds you that a trade whose stop isn't decided before entry is a bet, and you don't take it.
In Training, after you choose Long or Short, the app places the Stop 1 ATR from the entry and the Target 2 ATR away. You confirm, or you change your mind. If a candle touches both the Stop and the Target, the Stop wins. If price already opens beyond the Stop, the exit happens at the open, and the loss exceeds 1 R. In free replay, you move forward candle by candle and can move your stop up to breakeven. To learn more, read the page on the trading simulator.
Frequently asked questions
Where should you place your stop loss?
Where your trade idea becomes wrong: below the last swing low for a buy, above the last swing high for a sell, or beyond a support or resistance. Add a little room for wicks, a fraction of the average range of one candle.
How far away should a stop loss be?
There is no universal distance: it depends on the chart. Measure it in ATR, the average range of one candle. Over five years of Bitcoin on 4-hour candles, with random entries, a stop at 0.5 ATR was hit in 72% of cases within 24 hours, a stop at 2 ATR in 22% of cases.
Should you move your stop loss?
Only to reduce risk: move it closer, or up to the entry price once the trade has moved in your favor. Never to move it further away. A stop moved further away is no longer a stop, and the loss exceeds the planned R.
Does a stop loss guarantee the exit price?
No. A stop order with a trigger threshold becomes a market order when the threshold is reached. If price gaps, it is executed lower, sometimes much lower, as the AMF points out.
Mental stop or placed stop?
A placed stop executes without you. A mental stop depends on your decision at the worst moment, when price is getting close and the urge to wait grows. To practice discipline, place it.
 Mehdi Azizi created TradaZen and published it on the App Store through the Devoria studio. The app's scenarios are real past charts, never made-up data.
TradaZen is a training tool: you play on past market data with a simulated balance. It is not a broker and not investment advice. Real trading carries a risk of capital loss.