TradaZen
In 20 seconds
- Shape
- A large candle, then a small one of the opposite color whose body fits inside the large one's body.
- Where
- Bullish after a decline, bearish after a rally.
- What it tells you
- The side that was leading is no longer advancing. Over five years of Bitcoin, it did slightly better than chance, but the gap did not survive a change of settings.
- Confirmation
- The second candle has closed. Before that, the pattern does not exist.
- Invalidation
- The price moves back beyond the extreme of the large candle.
The harami is a two-candle pattern. The first candle is large and goes with the trend. The second is small, of the opposite color, and its body sits entirely inside the body of the first. At the bottom of a decline, it is a bullish harami. At the top of a rally, a bearish harami.
The word means "pregnant" in Japanese: the big candle carries the small one. It is the opposite of the engulfing pattern, where the second candle covers the first. Engulfing shows one side taking back control; the harami shows a move running out of steam.
This guide describes a training method, not investment advice. Trading carries a high risk of capital loss.
Spotting it
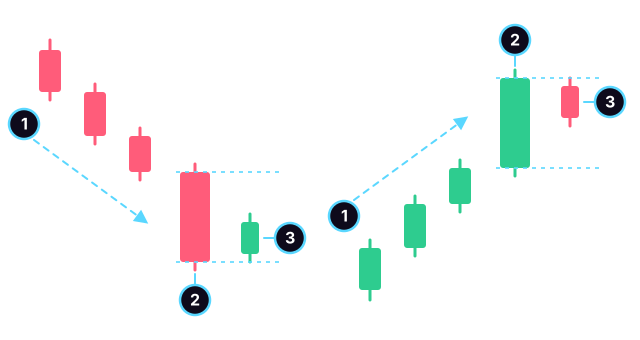
- The context: a decline on the left, a rally on the right.
- The first candle: large, in the direction of the trend.
- The second: small and of the opposite color. Its body sits between the two edges of the first one's body, marked with dotted lines.
Three things to check:
- The trend before it: a large red candle followed by a small green one in the middle of a range signals nothing. The harami is read at the end of a move.
- The bodies, not the wicks: it is the second candle's body that must fit inside the first one's body. Its wicks can stick out.
- The close of the second candle: until it is finished, it can still move outside the first one's body.
In crypto, the market never closes: the second candle almost always opens at the first one's closing price, so on the edge of its body. It then only has to move back the other way without going past the first candle's open. In stocks, the second candle can open inside the body, after an overnight gap.
Harami, harami cross, engulfing
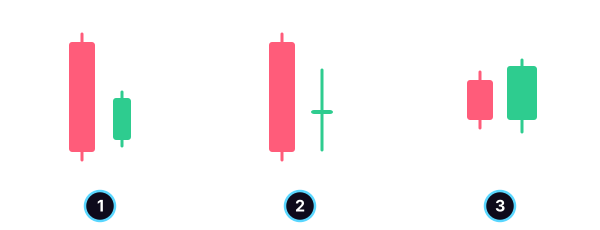
- The harami: a small body sitting inside the large one.
- The harami cross: the second candle is a doji, with an almost nonexistent body. The hesitation is stronger, the reading stays the same.
- Engulfing: the opposite, the second candle covers the first one's body.
The harami cross is often presented as the strong version of the harami. The numbers below do not back that up.
What 5 years of Bitcoin say
I flagged every harami over five years of Bitcoin, then checked where the price was six and twelve candles after the second candle. The expected direction: a higher price after a decline, a lower one after a rally. The baseline: every candle that follows a candle taken in the same trend.
| After… | Cases | Expected direction at 6 candles | Expected direction at 12 candles |
|---|---|---|---|
| a bullish harami | 233 | 58.4% | 54.5% |
| a harami cross, in a decline | 51 | 51.0% | 52.9% |
| after a decline (baseline) | 4,468 | 53.4% | 52.5% |
| a bearish harami | 234 | 58.1% | 53.4% |
| a harami cross, in a rally | 54 | 44.4% | 37.0% |
| after a rally (baseline) | 4,760 | 51.4% | 48.7% |
Method: BTC/USDT, 4-hour candles, public Binance data, from January 1, 2021 to December 31, 2025, or 10,956 candles. First candle: body at least half the candle, in the direction of the trend. Second candle: opposite color, not a doji, body inside the first one's body and at most half its size. Harami cross: the second is a doji (body at most 10% of the candle) sitting inside the first one's body. Decline: the first candle closes below the average of the previous 20 closes and below the close of 10 candles earlier; rally: the opposite. Measured from the close of the second candle. 95% margin of chance: about 6 points for the harami, 13 to 14 for the harami cross, 1.5 for the baselines. Past data: it does not predict the future.
The bullish harami does slightly better than the baseline, without leaving the margin of chance. Six candles later, the price was higher in 58.4% of cases, versus 53.4% for any candle after a decline: a five-point gap, against a margin of about six. At twelve candles, the gap drops to two points.
The bearish harami clears the margin at six candles, barely: 58.1% versus 51.4%, a gap of 6.7 points against a margin of 6.3. At twelve candles, it falls back inside the margin.
This result depends on the settings. Without requiring a decisive first candle or a second candle half its size, I find twice as many harami, 507 bullish and 494 bearish. The edge melts away: 54.6% and 54.0% at six candles, within the margin of chance on both sides. And when you run a dozen comparisons, one of them can clear the margin by pure chance.
The harami cross does no better than the plain harami. After a rally, it even does worse than the baseline, 37.0% at twelve candles, but on 54 cases the gap stays within the margin.
On the same data, engulfing did worse than the baseline, and the harami slightly better. That contradicts the idea that a more spectacular pattern would be more reliable, without making the harami a signal. It is a weak clue, to be read in context.
Trading it with a method
- Check the context. A real trend before the large candle, and if possible a level already tested: the support and resistance guide shows how to spot one.
- Wait for the second candle to close. Before that, it is not a harami.
- Compare the bodies, not the wicks.
- Place your stop beyond the extreme of the large candle: below its low for a bullish harami, above its high for a bearish one.
- Work out your ratio. The large candle pushes the stop further away. If the target is not worth at least twice your risk, skip it. The calculation is in the guide on the risk/reward ratio.
- Log the trade in your journal, win or loss.
A distant stop calls for a smaller position to keep the same risk. The 1% rule gives you the calculation.
Common mistakes
- Confusing harami and engulfing. In the harami, the small candle is inside the large one. In engulfing, it is the reverse.
- Reading a harami in the middle of a range, with no trend to slow down.
- Judging by the wicks: a second candle whose wick sticks out is still a harami if its body fits inside the first one's body.
- Entering before the close, because the candle "is staying inside."
- Remembering the 58% without the margin or the settings. A gap that disappears when you change the definition does not make a method.
Practice reading a body
The harami asks a simple question: does the last candle still have strength? TradaZen's "The candle" unit asks it on real charts: "The body of the last candle: decisive or hesitant?" You answer, then the app shows you how much of the candle the body takes up.
In Training, each scenario is a real past chart with what came next hidden. You choose Long, Short, or "I stay out," then the market reveals what it did, on a simulated balance. To see how it works, read the page on the trading simulator. For related patterns, see the doji and the morning star and evening star.
Frequently asked questions
What is a harami in trading?
It is a two-candle pattern: a large candle in the direction of the trend, then a small candle of the opposite color whose body fits inside the first one's body. It shows that the move has slowed. After a decline, it is called a bullish harami; after a rally, a bearish harami.
What is the difference between a harami and an engulfing pattern?
They are opposite patterns. In the harami, the second candle's body fits inside the first one's body. In engulfing, the second candle's body completely covers the first one's body.
What is a harami cross?
It is a harami whose second candle is a doji: the open and close at almost the same price, sitting inside the body of the large candle. Over five years of Bitcoin, it did no better than the plain harami.
Is the bullish harami reliable?
Not as a signal on its own. Over five years of Bitcoin on 4-hour candles, the price was higher six candles after a bullish harami in 58.4% of cases, versus 53.4% for any candle after a decline. The gap stays within the margin of chance, and it melts away with a broader definition.
What does harami mean?
The word means "pregnant" in Japanese. The large candle is the mother, the small one sitting inside its body is the child.
 Mehdi Azizi created TradaZen and published it on the App Store through the Devoria studio. The app's scenarios are real past charts, never made-up data.
TradaZen is a training tool: you play on past market data with a simulated balance. It is not a broker and not investment advice. Real trading carries a risk of capital loss.