TradaZen
In 20 seconds
- Shape
- Three candles: a large one in the direction of the trend, a small one that hesitates, a large one in the opposite direction.
- Where
- The morning star at the bottom of a decline, the evening star at the top of a rally.
- What it tells you
- The trend stalls, then the other side takes back a good part of the ground. It is rare: 33 morning stars in five years of Bitcoin on 4-hour candles.
- Confirmation
- The third candle closes beyond the midpoint of the first candle's body.
- Invalidation
- Price moves back beyond the star's extreme.
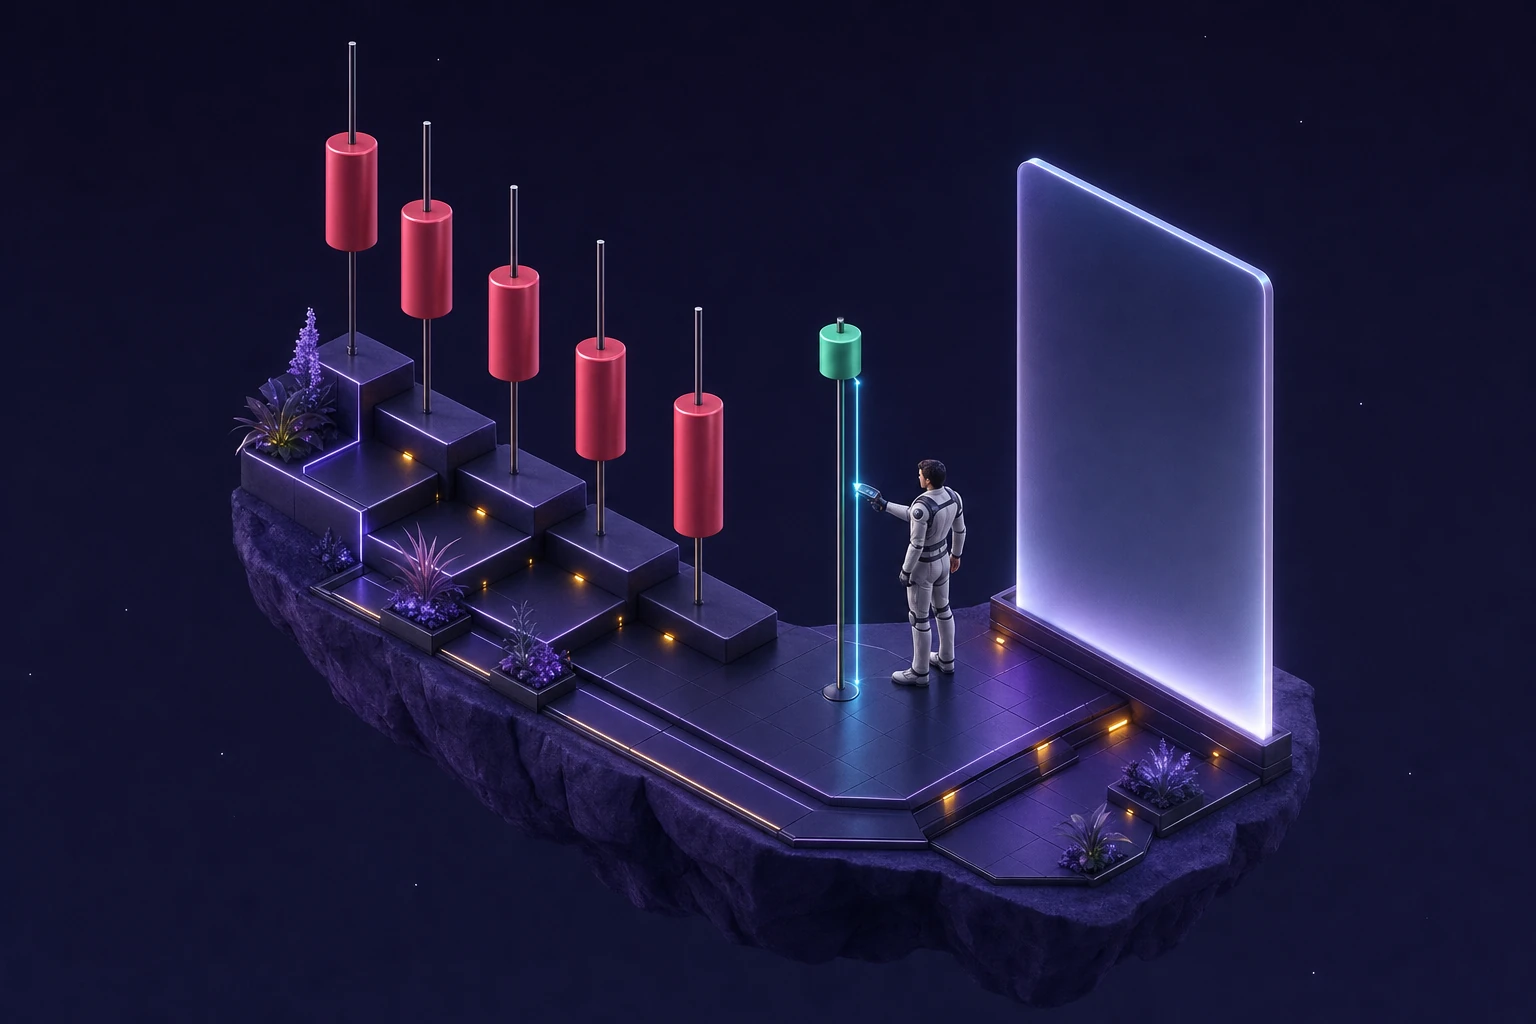
The morning star and the evening star tell the same story in three steps. A trend moves forward with strength. Then it stalls: a small candle hesitates, and that is the star. Finally, a large candle moves the other way and takes back a good part of the lost ground.
The name comes from astronomy: the morning star announces the day, the evening star announces the night. The pattern is rare, and often overrated.
This guide describes a training method, not investment advice. Trading carries a high risk of capital loss.
How to spot it
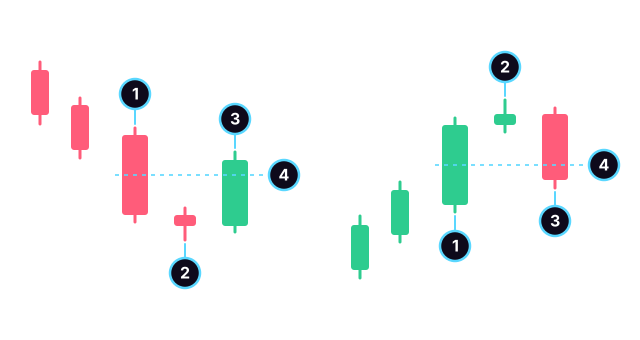
- A large candle in the direction of the trend. Its body is at least half of the candle.
- The star: a small body that does not reach back into the body of the first candle.
- A large candle in the opposite direction.
- The midpoint of the first candle's body. The third candle must close beyond it.
On the left, the morning star, at the bottom of a decline. On the right, the evening star, at the top of a rally.
Classic textbooks want a gap between the first candle and the star. In crypto, which trades around the clock, that gap almost never exists: the star opens where the first candle closed. So you keep the essential part: a small body that stays low for the morning star, high for the evening star.
When the star is a doji, with an almost nonexistent body, it is called a doji star. The hesitation is even clearer, and you read it the same way.
What 5 years of Bitcoin show
I looked for every star over five years of Bitcoin on 4-hour candles, then checked where the price was six and twelve candles after the third one. The baseline: every candle that follows a candle in the same trend.
| After… | Cases | In the expected direction after 6 candles | In the expected direction after 12 candles |
|---|---|---|---|
| a morning star (higher price) | 33 | 57.6% | 63.6% |
| any candle following a down candle (baseline) | 4,498 | 53.4% | 52.7% |
| an evening star (lower price) | 38 | 47.4% | 52.6% |
| any candle following an up candle (baseline) | 4,798 | 51.3% | 48.8% |
Method: BTC/USDT, 4-hour candles, public Binance data, from January 1, 2021 to December 31, 2025, for a total of 10,956 candles. First candle: body at least half of the candle. Star: body at most 30% of the first candle's body, reaching back into that body by no more than a tenth. Third candle: opposite direction, closing beyond the midpoint of the first candle's body. The star follows a decline (close below the average of the last 20 closes and below the close 10 candles earlier) or a rally (the reverse). Measured from the close of the third candle. Past data: it does not predict the future.
Look at the cases column first: out of 10,956 candles, 33 morning stars and 38 evening stars, roughly one of each every two months.
The morning star seems to beat the baseline: 63.6% after twelve candles, versus 52.7%. But with 33 cases, the margin of chance is about 16 points either way. The true proportion could be anywhere between 47% and 80%. No conclusion is possible.
The evening star does no better than the baseline: 47.4% after six candles, 52.6% after twelve.
A pattern this rare cannot carry a method on its own. It is one clue among others, to read alongside the trend and the levels.
Trading it with a method
- Check the context. A clear trend before the first candle.
- Wait for the third candle to close. The first two alone do not make a star.
- Check the midpoint of the body. A third candle that stops short has not taken back enough ground.
- Place your stop beyond the pattern's extreme: below the low of the morning star, above the high of the evening star.
- Calculate your ratio. The pattern spans three candles, so the stop is often far away. If the target is not worth at least twice your risk, skip it: the risk/reward ratio takes one line to calculate.
- Log the trade in your journal, win or loss.
A distant stop means a smaller position to keep the same risk. The 1% rule gives you the calculation.
Common mistakes
- Confusing it with the shooting star: the shooting star is a single candle with a long upper wick, after a rally. The evening star has three.
- Anticipating the third candle: entering on the star and betting on what comes next means trading a pattern that does not exist yet.
- Believing a three-candle pattern is three times as reliable: more candles do not mean more reliability.
- Remembering the 63.6% without looking at the 33 cases behind it. With so few, a handful of cases is enough to move the number by several points.
Practice deciding without seeing what comes next
On a finished chart, a star jumps out at you. When you have to decide, you do not know whether the third candle will come. That is the moment to train.
In TradaZen, each scenario is a real past chart with the rest hidden. You choose Long, Short or "I stay out," then the market reveals what it did, on a simulated balance. To see how it works, read the page on the trading simulator. For one- and two-candle patterns, see the hammer candle and bullish and bearish engulfing.
Frequently asked questions
What is the difference between the morning star and the evening star?
It is the same pattern, upside down. The morning star appears at the bottom of a decline: large red, small candle, large green. The evening star appears at the top of a rally: large green, small candle, large red.
Is the morning star reliable?
The data measured here cannot tell. Over five years of Bitcoin on 4-hour candles, it appeared only 33 times. Its result looks better than the baseline, but the gap stays within the margin of chance.
What is a doji star?
It is a morning or evening star whose middle candle is a doji: the open and close are at almost the same price. The hesitation is stronger, but you read the pattern the same way and it needs the same third candle.
What is the difference between an evening star and a shooting star?
The shooting star is a single candle, with a small body at the bottom and a long upper wick, after a rally. The evening star is a three-candle pattern. Both show buyers stalling at the top, but they do not appear at the same point.
 Mehdi Azizi created TradaZen and published it on the App Store through the Devoria studio. The app's scenarios are real past charts, never made-up data.
TradaZen is a training tool: you play on past market data with a simulated balance. It is not a broker and not investment advice. Real trading carries a risk of capital loss.