TradaZen
In 20 seconds
- Shape
- Three large candles of the same color, each opening within the previous body and closing beyond it, with short wicks.
- Where
- White soldiers after a decline, black crows after a rally.
- What it tells you
- One side controlled three periods in a row. The move it describes has already happened.
- Confirmation
- The third candle closed near its extreme. A small third candle, or one with a long wick, shows a move running out of steam.
- Invalidation
- Price falls back below the pattern's low for the soldiers, or rises above its high for the crows.
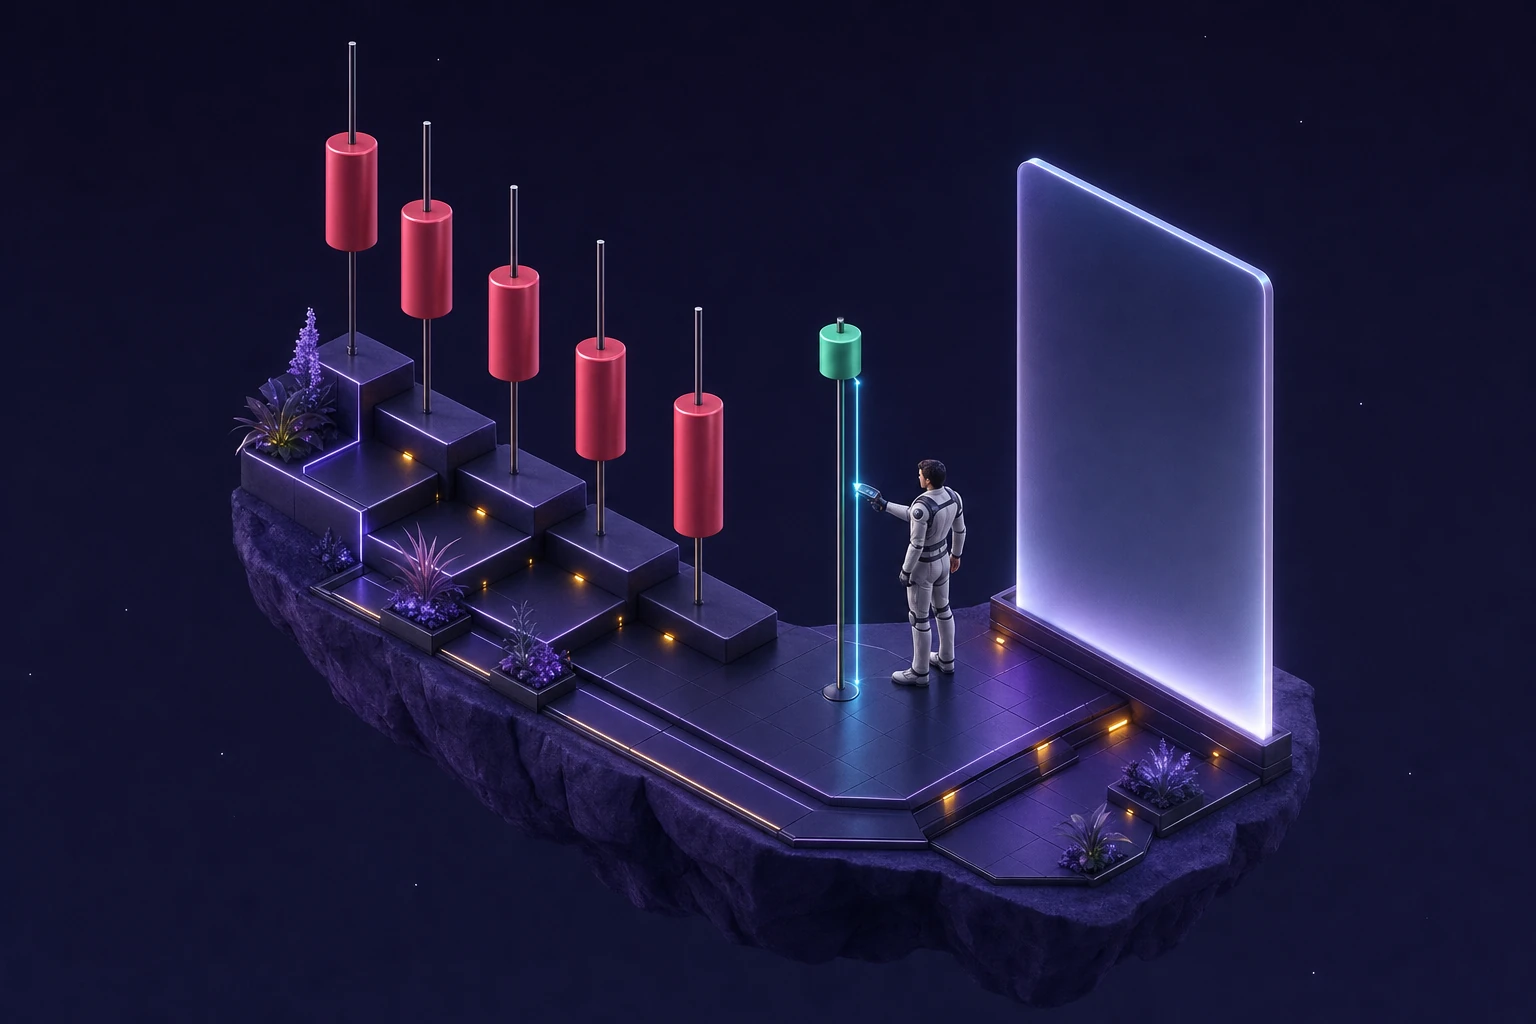
Three large green candles in a row, climbing step by step like troops in formation: that is the picture behind three white soldiers. The mirror image, three large red candles falling after a rally, is called three black crows.
The name comes from early candlestick charts, where up candles were white and down candles were black. On most platforms today, the soldiers are green and the crows are red. The pattern has a reputation as a strong signal. I looked for it across five years of Bitcoin, and I am not publishing a success rate. You will see why below.
This guide describes a training method, not investment advice. Trading carries a high risk of capital loss.
How to spot them
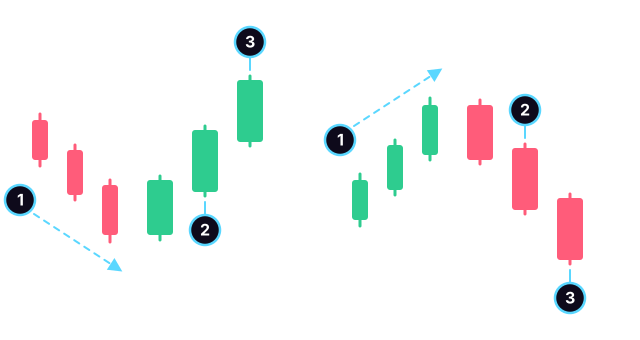
- The context: a decline on the left, a rally on the right.
- Three large bodies of the same color. Each candle opens within the previous body, or at its edge, and closes beyond it.
- Short wicks: each close lands near the extreme of its candle.
On the left, three white soldiers. On the right, three black crows.
Three things to check:
- Large bodies: three small green candles in a row are not soldiers. You need large bodies, larger than those of recent candles.
- Closes near the extremes: if the second or third candle has a long upper wick, or if the third is much smaller, textbooks read it as a rally running out of steam, not a sign of strength.
- The close of the third candle: two soldiers do not make the pattern.
In crypto, the market never closes: each candle almost always opens at the previous close, so at the top edge of its body. The condition "opens within the previous body" is met automatically.
What the pattern tells you
After a decline, buyers controlled three periods in a row, closing near the high each time. It is a picture of strength, and it is accurate: over those three candles, price really did rise.
The problem is practical. By the time the pattern is complete, price is already far from the low. A stop placed below the pattern is very far away; a tight stop sits in the middle of candles price has just moved through. The pattern describes a move that has already happened, at the exact moment you feel tempted to get in.
What 5 years of Bitcoin show
For this pattern, I tried to count on the same data as the other guides: BTC/USDT on 4-hour candles, from 2021 to 2025. A program looks for three large candles of the same color, each opening within the previous body and closing beyond it.
The problem comes from the settings. You have to decide what size makes a body "large": a share of the candle (40, 50 or 60%), a share of a candle's average range (the ATR over 14 candles), with or without a decline beforehand. Across these 18 settings, I found between 0 and 99 three white soldiers in five years, and between 0 and 65 three black crows. In 14 settings out of 18, fewer than 25 soldiers. With so few cases, the margin of chance runs from about 10 points to more than 40. And the share of cases where price was higher six candles later ranged from 43% to 100% depending on the setting.
When the result depends on the setting you choose, the measurement proves nothing: you could keep tuning until you got the number you wanted. So I am not publishing any rate for the pattern.
What I can measure is its simple version, with no settings: three candles of the same color in a row, whatever their size. It keeps the idea of the pattern, three periods in a row won by the same side.
| After… | Cases | Expected direction at 6 candles | Expected direction at 12 candles |
|---|---|---|---|
| three greens after a decline | 532 | 48.1% | 50.8% |
| same context (baseline) | 4,465 | 52.6% | 52.6% |
| three reds after a rally | 466 | 46.1% | 47.6% |
| same context (baseline) | 4,760 | 50.1% | 48.4% |
Method: BTC/USDT, 4-hour candles, public Binance data, from January 1, 2021 to December 31, 2025, or 10,956 candles. Three greens: three candles in a row that close above their open; the candle before closes below the average of the previous 20 closes and below the close 10 candles earlier. Three reds: the mirror image, after a rally. Expected direction: price higher after the greens, lower after the reds. Measured from the close of the third candle. Baseline: all candles placed three candles after a candle in the same context. Margin of chance at 95%: about 4 points for the three-candle runs, 1.5 for the baselines. Past data: it does not predict the future.
Three greens in a row after a decline did not signal a rise. Six candles later, price was higher in 48.1% of cases, versus 52.6% for any candle in the same situation: a gap of 4.5 points, just beyond the margin. At twelve candles, the gap falls within the margin. Three reds after a rally do no better than the baseline either.
This is consistent with the guide on candlesticks: on 4-hour Bitcoin, a run of same-color candles has tended to stop rather than continue. One market, one timeframe: on another asset, the result could differ.
Trading them with a method
- Check the context. A real decline before the soldiers, a real rally before the crows.
- Wait for the third candle to close. Before that, you only have two large candles.
- Look at the third candle. Small or with a long wick, it shows a move running out of steam.
- Measure the distance to your stop. Below the pattern, it is often very far. If the target is not worth at least twice that risk, pass: the guide on the risk/reward ratio walks through the calculation.
- Reduce your size if the stop is far. The 1% rule shows how to keep the same risk.
- Write your decision in your trading journal, even when you do not enter.
After three large candles, staying out is often the simplest decision: the move the pattern describes has already happened.
Common mistakes
- Chasing the move. Three large greens make you want to get in before it is too late. That is how FOMO works.
- Counting three small candles as soldiers.
- Ignoring the wick on the third candle, which tells you whether the strength held until the close.
- Setting a tight stop in the middle of the pattern, where price has just passed.
- Trusting a success rate you read elsewhere without the definition, the market, the period and the number of cases.
Practice not chasing three candles
Three large green candles make you want to buy. That reflex is what training is for. In TradaZen, each scenario is a real past chart, stopped at a real date, with what came next hidden. You choose Long, Short, or "I stay out". The Stop and Target are set for you: you see the risk before you confirm. Then the market reveals what it did, on a simulated balance.
The "The Candle" unit teaches you to judge a candle's body: "The body of the last candle: decisive or hesitant?" To see how it all works, read the page on the trading simulator or try a few trading exercises.
Frequently asked questions
What are three white soldiers?
It is a pattern of three large green candles in a row, after a decline. Each opens within the previous body, closes above it and near its own high. It shows that buyers controlled three periods in a row.
What is the difference between three white soldiers and three black crows?
It is the same pattern, reversed. Three white soldiers are three large greens rising after a decline. Three black crows are three large reds falling after a rally.
Are three white soldiers reliable?
No one can say without a precise definition. Searching for them by program over five years of Bitcoin, I found between 0 and 99 patterns depending on the settings, with results too dependent on those settings to publish a rate. Their simple version, three greens in a row after a decline, did not signal a rise.
Should you enter after the third soldier?
Not by reflex. By the time the pattern is complete, price is already far from the low, and the stop below the pattern is far too. Work out your ratio first: if the target is not worth at least twice your risk, staying out is a decision in its own right.
Why "white" if the candles are green?
On early candlestick charts, up candles were white, or hollow, and down candles were black. The name stuck, even though most platforms now display green and red.
 Mehdi Azizi created TradaZen and published it on the App Store through the Devoria studio. The app's scenarios are real past charts, never made-up data.
TradaZen is a training tool: you play on past market data with a simulated balance. It is not a broker and not investment advice. Real trading carries a risk of capital loss.